Reference · front-month futures · last price, delayed · change from exchange settlement
S&P 500 · ESZ26
7,688.50
−16.00
Nasdaq 100 · NQZ26
29,143.00
+1.00
Gold · GCZ26
$4,039.2
−21.20
Silver · SIZ26
$53.935
−1.072
2-Yr Note · ZTZ26
102′03⅝
−0′01⅞
10-Yr Note · ZNZ26
106′06½
−0′06½
WTI · CLZ26
$101.07
+1.60
Bitcoin (Micro) · MBTV26
$81,765
+310
There’s a surprise at every turn in the market. Yesterday blew up the stable rates narrative that had been building over the last couple of weeks. I had warned that a blow-up in crude prices could lead to the undoing of the idea that lower and stable rates would be supportive of equities and metals. That happened, but not the way I had envisioned it.
Instead, the Treasury market caught a massive turn higher, lower in rates. Yields on the 10-year broke down to as low as 4.939% around 2:00 PM. 10-year futures spiked to as high as 106′16½, up a whopping 1′13 points. As I remarked yesterday as I waxed nostalgic for the good old days, bonds reverted overnight to their historical place as a flight to safety. Futures have eased overnight and are trading 106′10. The yield is still under 5% at 4.97%. The MOVE Index of bond volatility spiked from 95.48 to 106.84! Typically, volatility will move inverse to rates, but volatility truly cuts both ways.
So, what drove this spike higher in volatility and big step down in rates? Oil was a culprit, and traded persistently higher, but that intraday strength didn’t even take hold until 11:00 AM, when it put in a local low at $97.90 and proceeded to march higher the rest of the session and through the overnight. It just peaked a few cents from Tuesday’s high of $101.37 at $101.31. The trend looks higher.
Crude being somewhat contained yesterday, all eyes were on equities. And what a tale of sector rotation happened there. Traders fled everything Tech. Nasdaq 100 futures were down 2.88% and S&P 500 futures were down 1.23%. However, in the major indices that are not dominated by the Semiconductor and AI sectors, there was a lot of relative strength. Dow futures are largely unchanged, and the win went to the Russell 2000, which was up on the day, but barely.
It’s worth noting here that big strength was seen in Consumer Staples (+3.11%), Utilities (+1.98%), Health Care (+1.33%), Financials (+1.18%), and Real Estate (+0.92%). The common theme that all of these sectors share is interest rate sensitivity.
Metals? They’ve just up and died. This is the part of the interest rate narrative that I have been struggling with and have not been able to reconcile. In a Goldilocks world, Gold and Silver should be rallying as yields and the dollar are falling. Or, at the very least, they shouldn’t be bleeding out in the ER. Gold futures were down 2.16% and Silver futures were down 4.68% yesterday. Gold has managed to hang on to the $4,000 handle and is currently trading $4,038.4 (−$22), and Silver is trading $53.965 (−$1.042). Silver has broken major support at $55.50. If it can’t quickly reclaim that, the next stop is $48.33, where there is a small volume ledge going back one full year. UGLY.
I wanted to save the Halloween tropes for next week, but I’ll continue to urge caution as we whistle past the graveyard of October and now the Midterm elections. Scary stuff!
I’ll continue to urge caution as we whistle past the graveyard of October and now the Midterm elections. Scary stuff!
Context I’m watching
Stable rates narrative blown up — from the other side. The 10-year yield broke to 4.939% around 2:00 PM; futures spiked to 106′16½, up 1′13, and have eased overnight to 106′10 with the yield at 4.97%. Bonds back in their flight-to-safety role.
Volatility cuts both ways. The MOVE Index spiked from 95.48 to 106.84.
WTI trend looks higher. From an 11:00 AM local low at $97.90 to $101.31, a few cents shy of Tuesday’s $101.37 high.
Sector rotation out of Tech. Nasdaq 100 −2.88%, S&P 500 −1.23%; Dow largely unchanged and the Russell 2000 barely up. Rate-sensitive sectors led: Staples +3.11%, Utilities +1.98%, Health Care +1.33%, Financials +1.18%, Real Estate +0.92%.
Metals bleeding out. Gold −2.16% and Silver −4.68% even as yields and the dollar fell. Gold holding the $4,000 handle at $4,038.4; Silver broke $55.50 support — next stop $48.33 if it can’t reclaim it.
Reference prices are front-month futures, delayed, for general information only — not investment advice; confirm before acting.
Morning Note
That Old Thug WTI
Thursday, October 22, 2026 · 5:45 AM ET
Reference · front-month futures · last price, delayed · change from exchange settlement
S&P 500 · ESZ26
7,714.25
−86.00
Nasdaq 100 · NQZ26
29,448.25
−558.75
Gold · GCZ26
$4,102.4
−47.60
Silver · SIZ26
$56.030
−1.680
2-Yr Note · ZTZ26
101′29½
+0′03⅜
10-Yr Note · ZNZ26
105′19½
+0′16
WTI · CLZ26
$99.70
+2.55
Bitcoin (Micro) · MBTV26
$81,820
−2,795
The stable rates narrative that has been building over the last couple of weeks remained intact yesterday. Rates did tick up a touch, but equities were broadly higher, led by tech, industrials, financials and utilities. Typically defensive sectors like healthcare and consumer staples lost some ground. Metals put in a halfhearted showing and Bitcoin had a ride.
This morning we find that old thug WTI causing problems in the neighborhood and applying some downward pressure on equities, metals and Bitcoin. Yields remain stable though. The 10-year yield is currently 5.073%, down 7.3 basis points. The MOVE Index finally had a major break and is now down to 95.94.
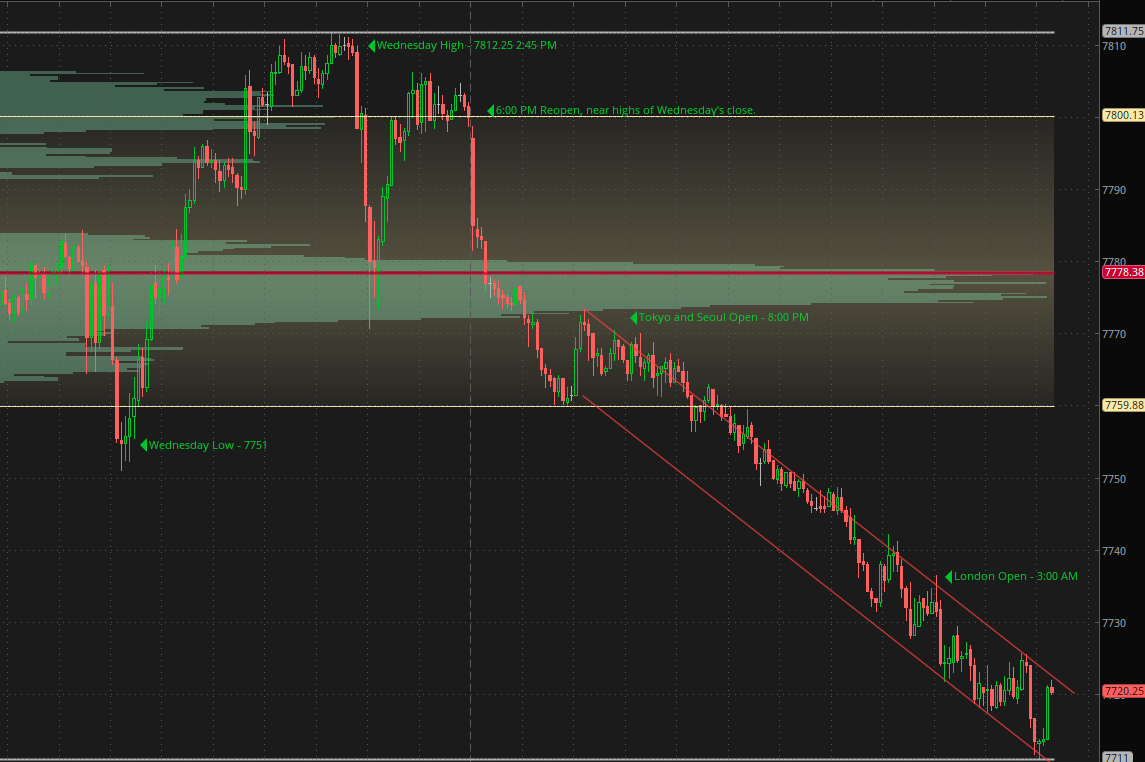
S&P 500 futures gapped almost 20 points lower as soon as trading re-opened at 6:00 PM Wednesday evening, and have been under steady downward pressure throughout the overnight. They are currently down about 80 points, or 1%, to 7720.
Micro E-mini S&P 500 futures, Wednesday through Thursday morning, with volume profile — the 7812.25 high, the drop after the 6:00 PM reopen through the 7778 point of control, and a steady down-channel through the Tokyo/Seoul and London opens to the 7711–7720 area.
Gold traded slightly higher yesterday while Silver lagged, but neither could find a spark. This morning Gold is down $47 to $4103.
WTI futures are screaming for attention again. I mean, what, petrodollars and global hegemony are a thing? Are we still talking about that? WTI futures had traded as low as $96.27 around 12:30 Wednesday afternoon, but have been on a steady march higher since. They reached a peak of $100.08 at 4:35 AM, broke a little down to $99, and look to be setting a range here for the moment between $99 and $100. WTI is currently trading +2.31 at $99.46.
10-year Treasury futures were down 6.5 ticks to 105′03½ on Wednesday morning, but they have come back bid in a strong and steady fashion, moving up to a high of 105′19½. Treasuries shaking off the inflationary pressure of higher crude reminds me of the old days when Treasuries were a flight-to-safety mechanism. That role seems to have largely shifted to the USD, but it’s heartening to see some “normal” behavior, even if it is short-lived.
Today is shaping up to be a sit-back-and-watch-things-play-out kind of day. The main concern is that WTI prices finally break meaningfully higher and throw the whole stable rates Goldilocks narrative out on its head. Stay cautious.
The main concern is that WTI prices finally break meaningfully higher and throw the whole stable rates Goldilocks narrative out on its head. Stay cautious.
Context I’m watching
Stable rates narrative intact. 10-year yield 5.073%, down 7.3 basis points; the MOVE Index finally broke, down to 95.94.
Sector mix. Yesterday’s gains were led by tech, industrials, financials and utilities; defensive healthcare and consumer staples lost ground.
ES under steady pressure. Gapped almost 20 points lower at the 6:00 PM reopen; down about 80 points, or 1%, to 7720.
WTI screaming for attention. From $96.27 Wednesday afternoon to a $100.08 peak at 4:35 AM; ranging $99–$100, now $99.46, up $2.31.
Treasuries acting like a haven. Ten-year from 105′03½ back up to 105′19½, shaking off higher crude — “normal” behavior, even if short-lived.
Metals without a spark. Gold slightly higher yesterday while Silver lagged; Gold down $47 to $4103 this morning.
Reference prices are front-month futures, delayed, for general information only — not investment advice; confirm before acting.
Morning Note
A Day Driven by Rumors
Wednesday, October 21, 2026 · 5:40 AM ET
Reference · front-month futures · last price, delayed · change from exchange settlement
S&P 500 · ESZ26
7,774.25
+19.00
Nasdaq 100 · NQZ26
29,837.00
+161.75
Gold · GCZ26
$4,140.8
−1.80
Silver · SIZ26
$57.525
−0.475
2-Yr Note · ZTZ26
101′28¼
+0′00⅛
10-Yr Note · ZNZ26
105′10½
+0′00½
WTI · CLZ26
$99.03
+1.21
Bitcoin (Micro) · MBTV26
$83,575
+1,005
S&P 500 futures ended the day yesterday at 7755.25, up 20.75 points. It was an interesting day that was driven largely by rumors. They came out of the gate swinging for the fences and reached as high as 7791.5 before selling off to VWAP down around 7750. They bounced off this line for most of the session. After the New York session closed, futures ripped back to 7786.25. They continued trading in this new elevated range through Asian hours, but at 3:30 the lights came on in London and it looks like some grumpy humans took over. At 3:27 futures were trading 7779.00, but have steadily sold back down to the 7760 area, closer to yesterday’s close.
10-year Treasury futures prices peaked in unison with the S&P yesterday to a high of 105′19½ and a trough at 1:00 PM of 105′07 before settling up 2 ticks to 105′10. Two-year Treasury futures trade down 1.5 ticks to 101′28⅛. Okay, so it’s just a couple of ticks on a day, but keep an eye on the movement of the Two-year in relation to the Ten-year as we get closer to the next FOMC meeting next week on the 27th and 28th. CME traders put the odds of a rate hike at this meeting at 14.9%, but December odds are 88.2%. It wouldn’t be at all surprising to see the Two-year trading squishy to the Tens, but that will probably come into more focus after next week.
The yield on the 10-year note is 5.119%. Steady! The MOVE Index of rate volatility is 101.7.
WTI futures had one heck of a ride yesterday. Rumors of peace in the Middle East sent prices plunging, but when those rumors proved to be unfounded and were replaced by a toothless anti-corruption program, they rebounded sharply. This one’s clearer in chart form.
Micro WTI Crude Oil futures, 5-minute bars — the 7:30 AM peak at $101.37, the plunge on peace rumors to the 10:00 AM trough at $95.25, and the rebound through the 1:30 PM corruption conference to $99.52 by 5:00 AM. Chart: thinkorswim.
What’s also clear is that the market wants peace in the Middle East and doesn’t care about the government fighting itself in corruption probes. Everybody sees that for what it is. Wasn’t DOGE supposed to get rid of waste, abuse and fraud already? What happened to that? Did it get a little too close to the heart of things? Likely.
The market wants peace in the Middle East and doesn’t care about the government fighting itself in corruption probes.
Context I’m watching
ES on rumors. Up 20.75 to 7755.25; high of 7791.5, then VWAP support around 7750. Ripped to 7786.25 after the close, then London sold it from 7779 back to the 7760 area.
Two-year vs. Ten-year into the FOMC. Ten-year settled up 2 ticks to 105′10 after a 105′19½ high; Two-year down 1.5 ticks to 101′28⅛. Meeting on the 27th and 28th: CME odds of a hike 14.9% at this meeting, 88.2% by December. Watch for the Two-year trading squishy to the Tens.
Rates steady. 10-year yield 5.119%; MOVE at 101.7.
WTI whipsaw. Peace rumors sent crude from $101.37 to $95.25; it rebounded once they proved unfounded. The market wants peace, not corruption probes.
Reference prices are front-month futures, delayed, for general information only — not investment advice; confirm before acting.
Morning Note
Oil Keeps a Lid on Everything
Tuesday, October 20, 2026 · 6:00 AM ET
Reference · front-month futures · last price, delayed · change from exchange settlement
S&P 500 · ESZ26
7,731.25
−3.25
Nasdaq 100 · NQZ26
29,621.75
−100.75
Gold · GCZ26
$4,131.2
−28.90
Silver · SIZ26
$57.235
−0.038
2-Yr Note · ZTZ26
101′28¾
−0′00⅞
10-Yr Note · ZNZ26
105′08½
+0′00½
WTI · CLZ26
$100.76
+2.22
Bitcoin (Micro) · MBTV26
$81,530
−300
Just a quick run through the markets to see how things are shaping up this morning.
S&P 500 futures bounced off Friday’s lows to 7773.25. They established a point of control at 7742 and traded mostly around that level all day. To emphasize this low-volatility point, VWAP for Friday ended at 7740.
ES futures have traded weaker so far in the London session, reaching a low of 7720 before catching a small bounce that is playing out now to 7732, −2.5 points.
Treasury futures are still steady, with the Ten-year trading up 2 ticks to 105′10. The 10-year yield is 5.12%, so it did edge up slightly since yesterday at this time. It’s about 4 basis points higher. The MOVE Index of bond volatility is 101.3.
WTI for December delivery is trading $2.11 higher overnight to $100.65 per barrel. See the attached chart to get some context. It’s easy to say it’s up or down day to day and lose sight of the trend. With a lack of other catalysts, oil seems to be keeping a lid on Equities, Metals, Treasuries (lack of reaction here makes me cautious) and the Dollar (see note on Treasuries). One could start feeling comfortable making the argument that Bonds and the Dollar brushing off higher crude could support the thesis that the turns are in on those. Naturally, being comfortable is not a safe place to be. We need to remain cautious on rates and the dollar. If WTI creeps much higher from here, narratives could unravel in a hurry.
Micro WTI Crude Oil futures, 1-hour bars over 20 days, with volume profile — weeks of balance around a $90 point of control, then a steady climb out of the range to above $100. Chart: thinkorswim.
Gold and Silver haven’t decided what program to sign up for and are listless. Gold has drifted back down to the $4138 area after being as high as $4220. Round number $4200 is psychologically important, and the more it gets tested from both sides, the more significant it becomes. Similarly, Silver has been trading back and forth over the $57.50 point of control from the last week. It is currently trading $57.17.
Bitcoin has been quiet, too quiet. It is still trading around the dashed orange support line drawn a couple weeks ago at $82,366. It is tracing out a new trading range rectangle just below, but largely overlapping, the previous rectangle. Of note, the $81,425 level it is currently trading at is very close to the 50% Fibonacci level. I hesitate to call 50% a Fibonacci level. It’s just 50%. Except for the fact that on a recent spike lower, that spike stopped right on the Fibonacci 61.8% level. These are measured from the 9/15 low to the 10/2 high. Could be nothing, but enough people pay attention that it becomes something.
Micro Bitcoin futures, 1-hour bars over 30 days — stair-stepping range rectangles beneath the dashed orange line, with price parked near the 50% retracement of the 9/15 low to 10/2 high and the recent spike low holding the 61.8% level. Chart: thinkorswim.
If WTI creeps much higher from here, narratives could unravel in a hurry.
Context I’m watching
ES pinned to its point of control. Bounced to 7773.25 Monday but spent the day around the 7742 point of control (Friday VWAP 7740); London low of 7720, now 7732.
Treasuries steady, maybe too steady. Ten-year at 105′10; the yield edged up about 4 basis points to 5.12%. MOVE at 101.3. The lack of reaction to crude oil makes me cautious.
WTI above $100. December crude at $100.65, up $2.11; look at the trend, not the day-to-day. With no other catalysts, oil is the lid on Equities, Metals, Treasuries and the Dollar.
Metals listless. Gold back to the $4138 area after $4220; $4200 grows more significant with every test. Silver chopping around its $57.50 point of control, now $57.17.
Bitcoin quiet, too quiet. Around the $82,366 dashed orange line, building a new rectangle; $81,425 sits near the 50% retracement of the 9/15–10/2 move, and the recent spike stopped on 61.8%.
Reference prices are front-month futures, delayed, for general information only — not investment advice; confirm before acting.
Morning Note
Assessing the Damage
Monday, October 19, 2026 · 4:00 AM ET
Reference · front-month futures · last price, delayed · change from exchange settlement
S&P 500 · ESZ26
7,749.00
+44.75
Nasdaq 100 · NQZ26
29,733.25
+341.75
Gold · GCZ26
$4,198.3
+17.20
Silver · SIZ26
$57.670
+0.365
2-Yr Note · ZTZ26
101′31½
+0′00½
10-Yr Note · ZNZ26
105′19½
+0′05
WTI · CLZ26
$96.88
−2.14
Bitcoin (Micro) · MBTV26
$82,680
+1,080
When we left off at 5:30 Friday morning, S&P 500 futures were trading around 7808 and pointing higher for New York. New York had a different plan in store and sold the futures almost immediately. The selling was pretty steady and cascaded all the way down to 7672.75. They settled the day at 7704.25, almost 100 points lower on the day, or down just over 1%.
So where does that leave us right now as we assess the damage? Let’s see if we can suss out some support and resistance levels for guidance. S&P 500 futures are currently up a healthy 45 points to 7749.25.
7743 (a small volume shelf) has been reclaimed. Overhead resistance is likely to come in at 7768.25 (point of control over the past month), and 7809–7812 (Friday’s high). Finally, 7888–7900, where some turns and all-time highs reside. If we can make it that high, expect a real battle before all-time highs are taken out. It’s likely that only a real news event would send us through that area without some fighting, depending on how the approach is set up.
Down below, support should come in at 7672.75 (Friday’s low), 7629.75 (low volume node), 7617.5 (goes back to 9/16), and finally 7585.5 (low with a strong reversal on 9/10).
In short, it’s messy out there after Friday, but some of the narrative remains intact. Ten-year and Two-year notes were both steady to up on the day in the face of higher crude oil. The US Dollar Index was down again as well. In early European trading, Treasuries are again stable to up a few ticks. We might have finally turned the corner on rates. The Ten-year is currently yielding 5.077%. The MOVE Index measurement of bond volatility also continues to ease. It is down from 114.46 to 101.1 in the last two weeks.
Given seasonal tailwinds in equities, steady rates, and an easing dollar, it’s easy to make the case that weakness in equities last week will turn out to have been a quick washout before the real construction into year end can commence.
It’s easy to make the case that weakness in equities last week will turn out to have been a quick washout before the real construction into year end can commence.
Context I’m watching
Friday’s reversal. New York sold ES from around 7808 down to 7672.75; it settled the day at 7704.25, down just over 1%.
Resistance overhead. 7743 (small volume shelf) reclaimed; next 7768.25 (one-month point of control), 7809–7812 (Friday’s high), then 7888–7900 and the all-time highs, where a real battle is likely.
Support below. 7672.75 (Friday’s low), 7629.75 (low volume node), 7617.5 (back to 9/16), 7585.5 (9/10 low with a strong reversal).
Rates turning the corner? Ten-year and Two-year steady to up despite higher crude oil, and up a few ticks again in early European trading; the Ten-year yields 5.077%.
Bond volatility easing. The MOVE Index is down from 114.46 to 101.1 over the last two weeks.
Dollar easing. The US Dollar Index was down again; with seasonal tailwinds and steady rates, the case for a quick washout.
Reference prices are front-month futures, delayed, for general information only — not investment advice; confirm before acting.
Morning Note
PPI Screams Hot, and Crickets
Friday, October 16, 2026 · 5:30 AM ET
Reference · front-month futures · last price, delayed · change from exchange settlement
S&P 500 · ESZ26
7,807.75
+16.75
Nasdaq 100 · NQZ26
30,170.00
+26.25
Gold · GCZ26
$4,206.0
+35.90
Silver · SIZ26
$58.005
+0.849
2-Yr Note · ZTZ26
101′30⅝
+0′00½
10-Yr Note · ZNZ26
105′16½
−0′00½
WTI · CLZ26
$95.35
−1.15
Bitcoin (Micro) · MBTV26
$82,215
−215
Sticking with the Ten-year Treasury futures to start this morning. After seeing the rapid rise in Treasury prices (drop in yields) early yesterday, I had a suspicion that we were being set up for a bit of a rug pull on the release of the Producer Price data, and that our reconstructed wall would come crashing down before we could get the last brick placed. Remember, just one day prior, a miss by 0.1% on the monthly Core CPI number was enough to send markets into a tailspin where Treasuries, Metals and Equities cracked.
Well, PPI came in screaming hot. It is often discounted a bit at the producer level because it doesn’t reflect prices at the pump, so to speak. But naturally, prices paid by the producers of things have to eventually find their way to the consumer. That said, headline PPI came in at +1.3% month over month and the core number came in at +0.7% month over month, trouncing estimates of +0.6% and +0.3% respectively. The news came and went, crude oil was moving higher, and crickets! It’s as if everybody looked around and said if they’re not going to sell them, let’s buy ’em! And so they did.
Ten-year futures ticked just a little higher and yields continued to ease. The fact that Treasuries didn’t crumble in the face of the inflationary onslaught (Retail Sales also came in hot at +0.8% on expectations of +0.3%) was all the confirmation the Metals and Equities markets needed to rally. The MOVE index measurement of Treasury volatility did tick up a little yesterday given the whipsaw action of the preceding couple of days, but it remained well off its highs.
S&P 500 futures were up 0.27% Thursday to 7791. Gold futures were 1.5% higher to $4170.1, and Silver futures were up 2.29%. All of these markets were off highs set a few days ago, but the sense of relief was palpable.
This morning we find S&P 500 futures grabbing back onto the 7800 handle. They continued where they left off yesterday afternoon and generally drifted higher throughout the Asian and early European hours.
Likewise, Gold and Silver are continuing to rebuild and reclaim lost support levels. Gold is back above $4200 at $4208.60, up $38.50, while Silver is back above $58 to $58.09, up $0.934.
WTI has been sneaking higher through all of the turmoil in the other markets. Its default seems to be two steps up and one step back whenever people aren’t paying attention. Note that today is the rolling of the contract months for WTI from November to December. There is roughly a $1.50 gap between them (December is lower). Reference will be to the front month. December WTI is about $1.10 lower this morning at $95.40.
Lastly, Bitcoin is continuing to mark time and is trading right on that orange support/resistance line that it has been glued to for almost two weeks. $82,175 is the last print there, off just $255.
Have a great Friday and weekend. Get outside and touch the grass.
It’s as if everybody looked around and said if they’re not going to sell them, let’s buy ’em!
Context I’m watching
Hot data, no rug pull. PPI +1.3% headline and +0.7% core month over month; Retail Sales +0.8% vs. +0.3% expected. Treasuries didn’t crumble, and that was the confirmation Metals and Equities needed.
Treasury volatility. The MOVE index ticked up after the whipsaw of the past couple of days but remains well off its highs.
ES back on the 7800 handle. Up 0.27% Thursday to 7791, drifting higher through the Asian and early European hours.
Metals reclaiming support. Gold back above $4200 at $4208.60; Silver back above $58 at $58.09.
WTI roll day. Rolling from November to December, with December roughly $1.50 lower; December at $95.40, down about $1.10. Two steps up, one step back.
Bitcoin glued to the orange line. Almost two weeks on the support/resistance line; last $82,175, off $255.
Reference prices are front-month futures, delayed, for general information only — not investment advice; confirm before acting.
Morning Note
CPI Knocks Down the Wall; Notes Put the Bricks Back
Thursday, October 15, 2026 · 5:55 AM ET
Reference · front-month futures · last price, delayed · change from exchange settlement
S&P 500 · ESZ26
7,749.00
−21.25
Nasdaq 100 · NQZ26
29,852.25
−330.50
Gold · GCZ26
$4,178.6
+70.70
Silver · SIZ26
$56.930
+1.053
2-Yr Note · ZTZ26
101′31⅛
+0′04⅜
10-Yr Note · ZNZ26
105′18
+0′22
WTI · CLX26
$94.53
−0.56
Bitcoin (Micro) · MBTV26
$81,355
−470
We have to start off with Notes. What a wild ride it has been in the last 20 hours on the Ten-year Treasury futures. After testing support at 103′28 four times in the last two weeks, and with bullish sentiment cracking below 1%, the Ten-year notes looked like they were building a constructive base. They were even able to muster the strength to print a 105 handle.
Then CPI hit with full force. Mind you, the headline number was in line with expectations at +0.6% MoM, and the Core (ex-Food and Energy) came in just a touch hot at +0.3% on expectations of a rise of +0.2%. Markets took the occasion of the blazing hot print to reveal which way the world was leaning and immediately sent both the Two-year and Ten-year futures to their respective lows. Two weeks of construction undone in an instant.
After a few minutes the market regained its composure, humans assessed the numbers as not all that bad, and started putting the bricks back into place. After a few hours the Ten-year was able to get to some air, and by the Asian open at 7:00 PM it had completely erased the breakdown and was clearing the way to recent highs.
10-Year Treasury Note futures (ZNZ26), with volume profile — two weeks of tests at 103′28, the CPI flush back to the floor, and the overnight recovery through 105. 30-day point of control 104′18. Chart: NinjaTrader.
This morning we are sitting at 105′18 and waiting on Retail Sales (est. +0.3% MoM) and the Producer Price Index (est. +0.6% MoM Headline, +0.3% MoM Core). Both are scheduled for 8:30. Has the market just reset the pins, only to knock them back down? PPI is typically a little looser and harder to predict than CPI, so it’s anybody’s guess. Yield on the 10-year Treasury right now is 5.077%.
So, what about everything else? S&P 500 futures were weak all day and finally took out the 1% down day marker, which had been ticking on the imaginary volatility clock for 53 straight trading days. They traded all the way down to 7729.5 overnight. It’s somewhat surprising that the S&P isn’t stronger on the breakdown in yields, but I suspect two things are holding it back. First is that the volatility in Treasuries is unsettling. It’s hard to commit funds when you don’t know when some statistic or tweet is going to come along and knock down your wall. Second is simply the makeup of the index itself. With AI-related and Semiconductor stocks garnering massive market capitalizations, they have taken a bigger share of the index. The S&P 500 is more susceptible now to movements in those stocks than it used to be. So, this morning S&P and Nasdaq futures are weaker, but Dow and Russell 2000 futures are higher. This is classic sector rotation.
Metals were crushed yesterday, particularly Silver, which was down over 6%, while Gold was down 1.66% to $4107.9. Both have rallied alongside the Ten-year note futures. Gold has erased yesterday’s losses and is back to $4178, while Silver finds itself higher but stuck. It is only up 1.75% to $56.85.
Finally, Bitcoin took out the lower edge of the box drawn on yesterday’s chart at $81,000. It traded as low as $80,055 before bouncing back into the underside of the box to trade $81,500. It’s been on the weak side for a week, but it’s not making many waves. Very hard to get a read on it at the moment.
Has the market just reset the pins, only to knock them back down?
Context I’m watching
Retail Sales and PPI at 8:30 ET. Retail Sales est. +0.3% MoM; PPI est. +0.6% headline, +0.3% core. PPI is looser and harder to predict than CPI.
10-year notes rebuilt the wall. Four tests of 103′28 in two weeks, a CPI flush to the lows, then a full recovery by the Asian open; now 105′18, with the 10-year yield at 5.077%.
The 1% clock reset. S&P futures broke a 53-session run without a 1% down day and traded down to 7729.5 overnight.
Sector rotation. S&P and Nasdaq futures weaker, Dow and Russell 2000 higher; AI and semiconductor weight makes the S&P more sensitive to those names.
Metals bounce with notes. Gold back to $4178 after yesterday’s drop to $4107.9; Silver higher but stuck at $56.85 after a 6%+ loss.
Bitcoin below the box. Broke $81,000, low $80,055, now back at the underside near $81,500. Hard to get a read.
Reference prices are front-month futures, delayed, for general information only — not investment advice; confirm before acting.
Morning Note
Marking Time Ahead of CPI
Wednesday, October 14, 2026 · 5:44 AM ET
Reference · front-month futures · last price, delayed · change from exchange settlement
S&P 500 · ESZ26
7,872.25
+16.50
Nasdaq 100 · NQZ26
30,786.25
−5.25
Gold · GCZ26
$4,165.6
−11.70
Silver · SIZ26
$58.770
−0.755
2-Yr Note · ZTZ26
101′27⅞
+0′00⅞
10-Yr Note · ZNZ26
104′28½
+0′05
WTI · CLX26
$94.75
+0.61
Bitcoin (Micro) · MBTV26
$83,335
−50
All major markets are steady this morning, with metals, bonds, oil and the dollar mostly unchanged. They are in a holding pattern awaiting the release of CPI at 8:30 ET this morning. Consensus estimates are looking for an acceleration of the headline number from 0.4% last month to 0.6% this month, and for CPI ex-food and energy to be 0.2% higher, slightly lower than August’s 0.3% gain. Nice how that works. The number that doesn’t include the things you need to live day to day is moderating (nothing to see here!), but the cost of everything you consume every day is accelerating. Food and energy? Why, those are too volatile for our polite numbers. Don’t worry, beef is still beef; it’s just that what used to be ribeye is now sirloin, and what was 93% lean is now 85% lean.
Early European trading finds the S&P 500 futures up 12 points at 7867.75. They have become very comfortable around the 7850 level, and that has pulled the point of control for the last week up to 7853. The range for the week is 7783 on the low side and 7887 up top. We are consolidating nicely in the top third of that range, waiting on catalysts in the form of earnings and economic statistics, both of which we have over the next few days as earnings season gets going in earnest for the third quarter.
Support and resistance remain largely unchanged given the recent range. Support is still 7848.5, the previous all-time high area, with some minor support below at 7835. 7773.5 is the monthly point of control, which is just below our low for the week. Look for meaningful support in this area if things start to get dicey to the downside. Below that we’re pretty clear until 7674. Let’s not go there! To the upside, the only real resistance is 7887 and 7897.5.
Micro E-mini S&P 500 (MESZ26), 1-hour, last 20 trading days, with volume profile and 100-period moving average — monthly point of control 7773.48; 7674.22 below, 7897.5 above. Chart: thinkorswim.
Treasuries looked good yesterday and had steady bids almost all day. Overnight we only got as low as 104′22 on the 10-year Treasury futures and as high as 104′29½ on the London open. Slow and steady here is just marking time ahead of the CPI release.
Metals are perplexing at the moment. Rates continue to stabilize, the dollar reversed off recent highs, and WTI isn’t on fire. All of these things should be putting a floor under Gold and Silver, but they continue to trade weakly. Gold futures are down $11 this morning to $4166.3, and Silver futures are down $0.79 to $58.735. Next support on Gold is $4150 and $4130. This market just keeps trickling lower day by day. Again, perplexing right here.
Bitcoin continues to consolidate just above its major support line. It is in the process of drawing out a new support and resistance box a little bit lower than the previous one that we had been working from. See the updated chart below. Another market that looks to be marking time.
Micro Bitcoin futures, 1-hour, with volume profile — the previous box (left) and the new, lower box forming above the major support line (orange dashed). Point of control $83,832. Chart: thinkorswim.
Marking time seems to be the theme this week. CPI a little later could break these markets free. It’s anybody’s guess which way they go. A cool inflation reading could light a fire under stocks, bonds, metals and crypto. We also have the history of October, particularly late October, as being quite bullish for equities. On the flip side, we have a serial Tweeter in Chief and a volatile WTI and War situation that could derail things in an instant. The tone of the markets this morning is cautiously optimistic, and that seems to be the right one.
Pray for peace. It used to seem cliché to me, but it’s truly heartfelt nowadays.
The tone of the markets this morning is cautiously optimistic, and that seems to be the right one.
Context I’m watching
CPI at 8:30 ET. Consensus: headline accelerating from 0.4% to 0.6%; ex-food and energy 0.2%, down from August’s 0.3%. A cool reading could light a fire under stocks, bonds, metals and crypto.
ES in the top third of the week’s range. Range 7783 to 7887, weekly point of control 7853. Support 7848.5, minor 7835, then the 7773.5 monthly point of control, and clear down to 7674. Resistance only 7887 and 7897.5.
Treasuries steady. Steady bids yesterday; overnight 104′22 to 104′29½ on the 10-year futures.
Metals perplexing. Gold down $11 to $4166.3 and Silver down $0.79 to $58.735 despite steadier rates, a softer dollar and a calmer WTI. Gold support $4150, then $4130.
Bitcoin drawing a new box. Consolidating just above its major support line, a little lower than the previous box.
Seasonals vs. headlines. Late October has a bullish history for equities; Tweets, WTI and the war could derail things in an instant.
Reference prices are front-month futures, delayed, for general information only — not investment advice; confirm before acting.
Morning Note
Marking Time, Waiting on the Banks
Tuesday, October 13, 2026 · 5:55 AM ET
Reference · front-month futures · last price, delayed · change from exchange settlement
S&P 500 · ESZ26
7,862.50
+4.50
Nasdaq 100 · NQZ26
30,752.75
−145.50
Gold · GCZ26
$4,210.3
+19.70
Silver · SIZ26
$60.690
+0.177
2-Yr Note · ZTZ26
101′28
+0′02⅜
10-Yr Note · ZNZ26
104′28½
+0′10½
WTI · CLX26
$91.92
−1.82
Bitcoin (Micro) · MBTV26
$83,760
+835
With the Treasury market closed for Columbus Day, and no news or earnings catalysts, equities traded thinly and were generally listless.
S&P 500 futures, which were trading near unchanged on the New York open Monday, proceeded to chop in a 15-point range for the morning before settling on the path of least resistance, which was lower. By 3:00 futures were on their lows at 7846.50 but managed to catch a bid back up to 7858.
Overnight trading has been very quiet as the market awaits a slew of earnings releases by the likes of JPMorgan, Goldman Sachs, Wells Fargo and Citi. We continue to mark time around the previous all-time high at 7848.5, trading as low as 7835.75 and as high as 7860.75.
The metals markets traded to the weak side as well, with Gold down 0.6% to $4190.6 and Silver down 0.88% to $60.513. They have bounced off lows overnight and are now trading $4207.9 and $60.75, respectively.
Crude oil crept higher all session Monday, settling up $1.89 at $93.74, and is now easing back a bit, down $1.64 at $92.10.
With the cash market closed for Treasuries, that market was quiet on the futures side. Ten-year futures have been ticking up through the overnight, though, and are up 10 ticks to 104′28. Two-year futures are likewise a bit stronger, trading up 2½ ticks at 101′27¾. The ten-year yield is now down five basis points to 5.194%. I can’t stress enough the importance of the easing of bond volatility. The MOVE index didn’t calculate yesterday because of the holiday, but VXTLT at the CBOE is currently quoted down 0.41%.
The Dollar index futures on the ICE exchange are also playing along with rate-sensitive markets this morning, trading down 0.23% at 102.135.
Lastly, our friend Bitcoin seems to have stabilized after that quick push through the lower edge of the support it had been clinging to. We find it up $800 this morning at $83,725.
All eyes this morning will be on big bank earnings. How are they navigating the volatile interest rate environment and flatter yield curve? Beyond that, the market will be looking forward to the government’s CPI and PPI data, which are due out Wednesday and Friday, respectively.
Pray for humble and sane leadership in our conflicts so that we can find some peace and stability in our daily lives.
I can’t stress enough the importance of the easing of bond volatility.
Context I’m watching
ES marking time at the old high. Monday low 7846.50 at 3:00, back to 7858. Overnight range 7835.75 to 7860.75, centered on the previous all-time high at 7848.5.
Big bank earnings. JPMorgan, Goldman Sachs, Wells Fargo and Citi: how are they navigating the volatile rate environment and a flatter yield curve?
Rates quietly firmer. Tens up 10 ticks to 104′28, twos up 2½ ticks; ten-year yield down five basis points to 5.194%. VXTLT down 0.41% with the MOVE index dark for the holiday.
Metals bouncing off lows. Gold $4207.9 after settling at $4190.6; Silver $60.75 after $60.513.
Crude easing back. Settled up $1.89 at $93.74 Monday; now down $1.64 at $92.10. The Dollar index is down 0.23% at 102.135.
Bitcoin stabilizing. Up $800 at $83,725 after the quick push through the lower edge of support.
Data ahead. CPI Wednesday, PPI Friday.
Reference prices are front-month futures, delayed, for general information only — not investment advice; confirm before acting.
Morning Note
Goldilocks Friday, Short Half-Life Monday
Monday, October 12, 2026 · 6:00 AM ET
Reference · front-month futures · last price, delayed · change from exchange settlement
S&P 500 · ESZ26
7,867.00
+7.25
Nasdaq 100 · NQZ26
31,081.00
−27.75
Gold · GCZ26
$4,194.9
−21.40
Silver · SIZ26
$60.975
−0.073
2-Yr Note · ZTZ26
101′25⅞
−0′00⅞
10-Yr Note · ZNZ26
104′16½
−0′02½
WTI · CLX26
$92.90
+1.05
Bitcoin (Micro) · MBTV26
$83,570
+1,100
Friday was a Goldilocks day for most equities and metals. With little news, and with both the rates and Crude oil markets stable, other markets were free to rally with a steady bid all the way from open to close.
On Friday the usual market-open volatility was limited to a small 15-point flush in the S&P 500 futures down to 7826.75. That proved to be the low of the session, and the market continued to press steadily up and to the right all day. We hit a high of 7870.50 just before 3:00 PM and ended trading at 5:00 PM at 7866, up 49.75 points.
Word over the weekend that Trump was working with Putin (are we still talking about Ukraine?) on a deal to ease pressure on the oil market by releasing Russian inventory into the market was seen as promising, and Friday’s mood carried into the Sunday night Asian open, with S&P futures trading as high as 7887, just shy of the all-time high of 7897.5 set last Tuesday. But as with most things Trump-headline-related since the war in Iran started, it is proving to have a short half-life. Since the European open the S&P futures are racing to unchanged after being up as much as 21 points. Look for support to come in at Friday’s close, 7866, and the previous all-time high of 7848.5. If we find ourselves further down the ladder, look for support at the volume shelf from last week at 7826. Overhead we only have 7897.5 before we’re back to blue sky and all-time highs.
Gold had staged a pretty nice relief rally late Thursday night and into Friday morning, trading as high as $4233.50. After a small pullback to test $4200 support, it pushed back up to settle near the high of the session at $4220.30, up $63.30. Silver traded even a little stronger than Gold, finishing the session up $1.686 at $61.11.
Very similar to the S&P futures, Gold opened strong Sunday night, trading up as much as $30 at $4240.3. It has since pulled back all the way into Friday’s zone and is testing support at $4200, down $16.
Probably the single most important factor in Friday’s sense of relief was steadiness in the Treasury market. I’ll say it again: the other markets can tolerate higher rates, but it’s the volatility and uncertainty in rates that they can’t stomach.
To support this thesis, look to the MOVE index, considered to be the VIX of bonds. It peaked at 114.46 on Monday the 5th and was down to 98.47 by Friday’s close, or −14%. For context, the 50-day average is 83.31. This turn down in bond volatility is largely a mirror image of the activity in equities and metals.
After rallying up to 104′26½ early Friday morning, ten-year Treasury futures pulled back to 104′12½ and steadied. They proceeded to trade in about a 4-tick range the rest of the day, ending at 104′19½. Even after the little bout of volatility seen overnight in equities and metals, the ten-year Treasury is little changed at 104′17, −2 ticks. The ten-year yield is 5.242%.
So, what about WTI futures? One would expect that they would crater on news of Trump and Putin cooperation on energy. As is typical of the markets, they are largely defying expectations. WTI futures initially rallied about $1 to $92.63, then sold down to $89.61 a few hours later, only to rally again back up to highs of $92.77. Trump-headline half-life illustrated for amusement below. Keep in mind that Crude oil volatility will spill into the Treasury market if it is perceived to be burning too hot.
Micro WTI Crude Oil (MCLX26), 5-minute, overnight session through 5:30 AM ET, with volume profile — the round trip from $92.77 to $89.61 and back. Chart: thinkorswim.
Looking ahead this week, we should see a ramp-up in volatility. That’s volatility in the strict sense of the term and not to be taken as a negative. The news calendar has the release of both CPI and PPI, Wednesday and Friday, respectively. This week will also bring a big ramp-up of third-quarter earnings releases from some big AI/semiconductor names and the biggest names in the financial sector.
The other markets can tolerate higher rates, but it’s the volatility and uncertainty in rates that they can’t stomach.
Context I’m watching
ES back to unchanged. The Trump–Putin rally took futures to 7887 overnight, 21 points up and just shy of the 7897.5 all-time high, before fading. Support at Friday’s 7866 close, the old all-time high at 7848.5, then the 7826 volume shelf; overhead only 7897.5 before blue sky.
Gold testing $4200. Friday’s high $4233.50, close $4220.30; up to $4240.3 Sunday night, now back into Friday’s zone. Silver outperformed Friday, up $1.686 to $61.11.
Bond volatility easing. MOVE index from 114.46 on the 5th to 98.47 Friday (−14%), still well above its 83.31 50-day average. Tens little changed at 104′17; ten-year yield 5.242%.
WTI’s headline round trip. $92.63 to $89.61 and back to $92.77 overnight, despite the energy-cooperation news. Watch for Crude oil volatility spilling into Treasuries.
Week ahead. CPI Wednesday, PPI Friday, and third-quarter earnings from big AI/semiconductor names and the largest financials.
Reference prices are front-month futures, delayed, for general information only — not investment advice; confirm before acting.
Morning Note
Risk Out, Stability In
Friday, October 9, 2026 · 6:00 AM ET
Reference · front-month futures · last price, delayed · change from exchange settlement
S&P 500 · ESZ26
7,843.50
+27.25
Nasdaq 100 · NQZ26
31,197.75
+228.25
Gold · GCZ26
$4,207.6
+50.60
Silver · SIZ26
$60.570
+1.146
2-Yr Note · ZTZ26
101′26⅞
−0′01⅞
10-Yr Note · ZNZ26
104′17½
−0′05½
WTI · CLX26
$90.68
−0.81
Bitcoin (Micro) · MBTV26
$82,850
+900
If the first week in October is any predictor of relative winners and losers over the remainder of the year, then risk is out and stability is in. AI and Semiconductor stocks were walloped hard yesterday, with the Nasdaq 100 index (tech heavy, they like to say) down almost 1.5%, while the broader S&P 500 index was off about 0.5%. And maybe more importantly, the Russell 2000 index finished the day virtually unchanged, while the S&P Equal Weight Index was up 0.6%! What do the Russell 2000 and S&P Equal Weight Index have in common? They are not slaves to AI and Semiconductor sentiment. One day of relative outperformance doesn’t carry a lot of weight, but keep an eye on these two lagging indexes and see how they perform over the remainder of the quarter.
S&P 500 futures traded up and to the right in steady fashion overnight, and we find ourselves trading up 27 points at 7849.75. This is the first area of resistance listed in yesterday’s post. Let’s see if the other markets feel like cooperating today and keep things pointed up and right.
Ten-year Treasury futures threatened to take out the 103′28½ low early yesterday, printing 104′00 before embarking on a sharp rally to end the day at its high, 104′24. Notes are stable this morning and trading in a range between 104′18 and 104′24. The yield at the moment is 5.248% after coming off a jaw-clenching high of 5.35%. It’s common for Treasuries to trade weakly into auctions as dealers prepare for the new inventory and hedge their existing portfolios. This pre-auction concession and hedging usually goes unnoticed by most, but given the hyperfocused attention on rates it was much more noticeable than usual yesterday. Both the 10-year and 30-year auctions went very well. Indirects (foreign buyers) came in strong, and that helped buoy spirits in the bond markets. Look for 105′09 to clear overhead before declaring the all clear on rates. There is plenty of work to do between here and there.
Gold futures have been struggling this week to stay above $4,150. The point of control for the week is $4,169. They stabilized once the Treasury market auctions were finished and rates eased off highs. Gold has been strong overnight and is up about $55 to $4,212.
Bitcoin futures came into yesterday’s session skidding along the lower edge of the support range they had been tracing out for days. That support finally broke, and futures for October traded as low as $80,525 before recovering — you guessed it — after the Treasury auction concluded at 1:00 PM ET. Bitcoin has since recovered back into that previous support and is trading $82,870 this morning. I have mentioned that I think Bitcoin is worth watching as a barometer for risk appetite. Yesterday’s breakdown might have been a warning signal on the risk front. There was a lot of turmoil under the surface in equities yesterday, with a very decided shift in tone. Risk was out and sanity was in.
If the first week in October is any predictor of relative winners and losers over the remainder of the year, then risk is out and stability is in.
Context I’m watching
A shift in leadership? Nasdaq 100 down almost 1.5% and the S&P 500 off about 0.5%, while the Russell 2000 finished virtually unchanged and the S&P Equal Weight rose 0.6%. Watch these two lagging indexes through the quarter.
ES at the first resistance. A steady overnight grind, up 27 points at 7849.75 — right at the first resistance from yesterday’s post.
Tens: auctions went well. 104′00 low, then a sharp rally to close at the 104′24 high; now 104′18 to 104′24. Strong indirect bids at both the 10- and 30-year auctions. 105′09 needs to clear before the all clear on rates.
Gold back above the weekly POC. Struggling to hold $4,150 this week; the weekly point of control is $4,169. Up about $55 overnight to $4,212.
Bitcoin: a risk warning? Broke the box’s lower edge to $80,525, recovered after the 1:00 PM auction, now $82,870 back inside the old support.
Reference prices are front-month futures, delayed, for general information only — not investment advice; confirm before acting.
Morning Note
Building a Map After the Breakout
Thursday, October 8, 2026 · 6:00 AM ET
Reference · front-month futures · last price, delayed · change from exchange settlement
S&P 500 · ESZ26
7,821.50
−31.25
Nasdaq 100 · NQZ26
31,225.75
−176.50
Gold · GCZ26
$4,150.4
+9.70
Silver · SIZ26
$59.235
−1.059
2-Yr Note · ZTZ26
101′25⅝
−0′02¾
10-Yr Note · ZNZ26
104′03
−0′12½
WTI · CLX26
$91.96
+3.68
Bitcoin (Micro) · MBTV26
$83,230
−390
Coming into the S&P 500 futures this morning, we find ourselves trading near yesterday’s low of 7815.75. We are down 28 points to 7824.75. Taking a look at other markets, it looks like the usual suspects are to blame for pouring cold water on our stock market party. WTI futures are currently trading up $3.65 to $91.93, and ten-year Treasury futures are off 10.5 ticks at 104′05.
Now that the “longstanding” high at 7848.5 has been taken out in the S&P and we’ve had some two-way trade, we can start to build out a profile of support and resistance levels that might help us navigate going forward.
Stepping back to a daily timeframe, we are clearly in an uptrend and just about 1% off the all-time high of 7897.5. The point of control for the past year is about 1000 points below at 6864. Adjusting our diopters a few clicks down to the hourly timeframe, we get a lot more granularity. Looking back over the most recent month, our POC ratchets up to 7773.5. Drilling down a couple of clicks further to the 15-minute timeframe for the last 5 trading days, we find the POC is very close to the POC for the month at 7775.5. By its very nature this has become an important support point.
Drawing a box of support and resistance for reference as we make our way through the next one to three days, we hope to find support right here at 7820, but below that we have local highs of 7794, POC 7775, 7754, and 7732 before 7000. We haven’t traded much up above, so there is only the old all-time high at 7848.5, 7858.75 and 7897.5 for resistance. See the attached chart for visual context.
Micro E-mini S&P 500 (MESZ26), 15-minute, last five trading days, with volume profile — point of control 7775.38; resistance at 7848.5, 7858.75 and 7897.5. Chart: thinkorswim.
As mentioned at the outset, WTI is making noise to the upside, and bonds are skidding along near lows. Gold and Silver are near recent lows but holding steady, and Bitcoin is testing the lower edge of the box we showed earlier this week around $83,000.
Now that the “longstanding” high at 7848.5 has been taken out and we’ve had some two-way trade, we can start to build out a profile of support and resistance levels that might help us navigate going forward.
Context I’m watching
ES: back near yesterday’s low. Down 28 to 7824.75, near the 7815.75 low; about 1% off the 7897.5 all-time high, still in a daily uptrend.
The point of control ratchets up. Past year 6864; past month (hourly) 7773.5; last five days (15-minute) 7775.5 — an important support point by its very nature.
Support / resistance box for the next one to three days. Support 7820, then 7794, 7775, 7754 and 7732. Resistance at the old high of 7848.5, then 7858.75 and 7897.5.
The usual suspects. WTI up $3.65 to $91.93; tens off 10.5 ticks at 104′05, skidding along near lows.
Metals and Bitcoin. Gold and Silver near recent lows but holding steady; Bitcoin testing the lower edge of its box around $83,000.
Reference prices are front-month futures, delayed, for general information only — not investment advice; confirm before acting.
Morning Note
Beware the Currents Pulling Underneath
Wednesday, October 7, 2026 · 5:30 AM ET
Reference · front-month futures · last price, delayed · change from exchange settlement
S&P 500 · ESZ26
7,866.00
−8.00
Nasdaq 100 · NQZ26
31,363.50
−119.75
Gold · GCZ26
$4,145.4
−41.70
Silver · SIZ26
$60.520
−1.069
2-Yr Note · ZTZ26
101′25¾
−0′01
10-Yr Note · ZNZ26
104′07
−0′09
WTI · CLX26
$89.76
+0.32
Bitcoin (Micro) · MBTV26
$83,840
−2,020
Generally quiet overnight action in both Asian and early European trading after blasting through to new all-time highs on the S&P 500 futures yesterday. After finally cracking 7848.5, futures extended through to 7897.5, thereby leaving 7900 and 8000 as the next logical overhead resistance targets. S&P 500 futures faded back a bit to bounce off VWAP a couple of times during yesterday afternoon in the 7870 area, and overnight they have traded mostly around VWAP in the 7868 to 7885.5 range. Currently we are down 8 points from yesterday’s exchange settle of 7874, at 7866.
Metals had a decent day yesterday, but didn’t show any real spark. Gold traded as high as $4,212.6 late in the US session but faded through Asian and European trading, and is now back down near recent lows, trading $4,150. The weekly point of control is up above at $4,190.7, and is the first line of overhead resistance that needs to be overcome if a rally is ever going to take hold. Action in the metals is largely being driven by a very strong US Dollar, more so than rates, although all three are intertwined and are dancing around each other.
US Treasury futures finally had a steady to up day yesterday. This proved to be the fuel behind the fire in equities yesterday. Like Gold, they have leaked lower through the Asian session. The weekly point of control for ten-year Treasury futures is 104′06½, and they are currently right there at 104′08½.
Bitcoin traded inside of the box that it has been tracing out, roughly $87,000 to $83,700. The weekly point of control is just overhead at $85,838, while we are trading modestly lower at $83,850. Not much to add here as Bitcoin continues to consolidate above $83,000.
All in all, overnight and going into this morning looks neutral to negative. After notching all-time highs, the market as expressed through the S&P 500 futures is behaving largely as expected and taking a breath before deciding which way to go. Probably the biggest determinant in my view is how Interest Rates and the US Dollar behave here. They are both teetering on a cliff’s edge that has the potential to be the undoing of equity progress. Beware the currents pulling underneath. The Russell 2000 futures were lower by over 0.5% yesterday on a day when it looked like it was all systems go. Semiconductors, which have been largely responsible for holding equities up in recent weeks, were also flat to weak on the day yesterday. This could be nothing more than sector rotation going into the final quarter, but it is something to keep an eye on as we make our way through the setting of the Q4 table.
Interest Rates and the US Dollar are both teetering on a cliff’s edge that has the potential to be the undoing of equity progress. Beware the currents pulling underneath.
Context I’m watching
ES: new all-time highs, now taking a breath. Cracked 7848.5 and ran to 7897.5; 7900 and 8000 are the next overhead targets. Overnight it held around VWAP in a 7868 to 7885.5 range before slipping to 7866, down 8.
Gold: back near recent lows. $4,212.6 high late in the US session, now $4,150. The $4,190.7 weekly point of control is the first resistance any rally has to clear.
The Dollar is driving metals. A very strong US Dollar more so than rates, though all three are intertwined.
Tens: right at the weekly point of control. A steady to up day fueled equities, then leaked lower in Asia; POC 104′06½, trading 104′08½.
Bitcoin: still boxed. Roughly $83,700 to $87,000; weekly point of control $85,838 overhead, consolidating above $83,000.
Beneath the surface. Russell 2000 futures down over 0.5% on an all-systems-go day, and semiconductors flat to weak. Maybe just Q4 sector rotation, but worth watching.
Reference prices are front-month futures, delayed, for general information only — not investment advice; confirm before acting.
Morning Note
Knocking on All-Time Highs
Tuesday, October 6, 2026 · 5:30 AM ET
Reference · front-month futures · last price, delayed · change from exchange settlement
S&P 500 · ESZ26
7,846.25
+20.00
Nasdaq 100 · NQZ26
31,410.50
+92.75
Gold · GCZ26
$4,183.8
+27.00
Silver · SIZ26
$61.465
+0.165
2-Yr Note · ZTZ26
101′25½
+0′01⅜
10-Yr Note · ZNZ26
104′15½
+0′08½
WTI · CLX26
$87.83
−1.60
Bitcoin (Micro) · MBTV26
$86,140
+135
S&P 500 futures are sitting just below all-time highs. 7848.5 was the all-time high on 9/22, and futures have traded as high as 7847 overnight. Given the lack of overhanging news and Fed speeches, the market was free to follow the path of least resistance yesterday and rallied steadily all day until just before the close, when there was a dump down toward VWAP. With futures flirting with 7848.5, it looks like the sky’s the limit in terms of resistance levels. Down below we’ll be looking for support to come in at 7816, 7787.5, 7775.5, 7715 and 7690. Plenty of ledges to grab onto on the way down, thanks to the choppy nature of the rise.
I’m not sure which is more surprising: that stocks were strong yesterday in the face of weaker bonds, or that bonds were weaker in the face of stronger stocks. The still squishy nature of the Treasury market does make me nervous about the stock market rally. At the very least, it should act as a check on animal spirits that sometimes come into play.
Ten-year futures traded just off of last week’s lows, down to 104′00, before buyers came in and bought them up to about 104′08. Bids have remained supportive overnight, and we come into this morning trading 104′15. Action like this is just the kind of stability we need to let the other markets break free from their September shackles. Yields on the 10-year are currently quoted at 5.273%.
Also notable was that bonds were soft given very weak WTI futures. They were down all day yesterday. They traded as low as $88.76 yesterday afternoon, rallied up to $90.04 overnight, and are now down through yesterday’s lows to $87.63. Yes, it seems we can all just get along when Fed speakers and manic tweeters get out of the way.
Metals were steady to weak all day yesterday, with Gold chopping around the $4,150 level. It is currently up $21 to $4,177.8 after touching a low of $4,130.9 during Asian trading. In and of itself some consolidation is healthy, but Gold seems to be trading like Treasuries. Either Metals and Bonds are showing stability so that equities can remain constructive, or they are flashing warning signs by not playing along. Let’s hope it’s the former and October’s historical tendencies are taking hold.
Bitcoin futures traded comfortably in the box shown in yesterday’s post and stayed within a narrow range of $85,445 to $87,380. We are currently trading $86,380, with the weekly point of control just below at $84,358. That would be the likely first test below, and the next stop would be $82,850. Given the lack of any real catalyst at the moment, BTC is likely to continue consolidating in the box that it has traced out over the last couple of weeks.
Either Metals and Bonds are showing stability so that equities can remain constructive, or they are flashing warning signs by not playing along.
Context I’m watching
ES: a point and a half from the record. The 9/22 all-time high is 7848.5; overnight high 7847. Support at 7816, 7787.5, 7775.5, 7715 and 7690 — plenty of ledges thanks to the choppy rise.
Stocks up, bonds soft. The still squishy Treasury market is a reason for nerves about the rally, and at least a check on animal spirits.
Tens: steadying. Down to 104′00 just off last week’s lows, bought back to 104′08, now 104′15. The 10-year yield is 5.273%.
WTI: through yesterday’s lows. $88.76 low yesterday, $90.04 overnight, now $87.63.
Gold trading like Treasuries. Chopping around $4,150, Asian low $4,130.9, now $4,177.8. Stability that lets equities stay constructive — or a warning sign.
Bitcoin: still in the box. $85,445 to $87,380 yesterday; weekly point of control $84,358 is the first test below, then $82,850. No real catalyst, so more consolidation likely.
Reference prices are front-month futures, delayed, for general information only — not investment advice; confirm before acting.
Morning Note
Stability Will Be Key
Monday, October 5, 2026 · 5:00 AM ET
Reference · front-month futures · last price, delayed · change from exchange settlement
S&P 500 · ESZ26
7,770.50
−6.75
Nasdaq 100 · NQZ26
31,030.25
−31.50
Gold · GCZ26
$4,194.9
+32.60
Silver · SIZ26
$62.085
+1.670
2-Yr Note · ZTZ26
101′25⅝
+0′01¼
10-Yr Note · ZNZ26
104′14
+0′02½
WTI · CLX26
$90.91
−0.20
Bitcoin (Micro) · MBTV26
$86,130
+1,540
It was a Goldilocks open for markets on Friday. Employment figures came in cool and prior months were revised lower, and in the topsy-turvy, twisted logic of Wall Street, bad news is good news. Given the cool readings, everything that should have been green was green, and by the open it was looking like it was going to be a stellar day. But markets, doing what they do best, proceeded to dash hopes and dreams, did their thing, and went sellers. Recall the Trader’s Almanac article that was linked to late last week. Historically, it takes October 5 to 8 trading days to shake off September memories. The Trader’s Almanac article can be found here.
S&P 500 futures came out of the gate strong and rallied to 7805, faded to 7773.5, and rallied back to 7808.75, all in the first hour. They turned south again down to 7754 at 11:30, and then caught a bid once Europe closed, chopping in a range until closing at 7776.5 (up 52.5) at 5:00.
Overnight the futures opened with a healthy bid and drifted higher up to 7792.75. Then something gave way at 9:45 PM and markets started moving lower. Futures drifted lower through the overnight down to 7761.5 before finding some support and chopping around into European trading. We’re now down 6 points at 7770.5.
Ten-year Treasury note futures rallied sharply on the release of NFP, trading as high as 105′08 before reversing and trading down to 104′07 by 1:30. They chopped around a bit just off lows and ended at 104′11½, down 9.5 ticks. Bullish sentiment on the 10-year is down to 1.4%, but it is off Monday’s lows and could be looking for a place to stabilize. Overnight looked stable, with prices trading in a narrow range from 104′14 to 104′18½. Yields are off highs at 5.26%. It won’t take a massive rally in bonds (turn down in yields) to spark a healthy year-end Risk On rally across most other assets. Lower rates will be great, but stability will be key. Lower rate volatility is more important than lower rates for the moment.
Bitcoin had an interesting session on Friday and put in what looked like a pretty big reversal on the smaller timeframes. It spiked up to $87,765, taking out recent highs, before reversing sharply down throughout New York hours to $84,165.
Stepping back to the daily chart below to gain some perspective, Friday’s action was uneventful aside from the big wick it left behind. It appears that the stair-step rally that started in earnest in mid-August is still playing out. Note too that the latest consolidation that started 9/21 is still very much intact and keeping above that dashed support/resistance line at $82,350. Additionally, the volume profile shelf is just above at $90,000.
Micro Bitcoin futures, daily — the stair-step rally since mid-August, with the consolidation that began 9/21 holding above the dashed support/resistance line. Chart: thinkorswim.
Some stabilized rates and a peace catalyst could project to $100,000 in pretty short order if the last four months are our guide. Bitcoin futures have drifted higher overnight and are trading +1780 at $86,370. Support in the form of the monthly point of control is just below at $84,360. Stay tuned here. I do think the Risk On/Risk Off story for the broader market is likely to be traced out here.
Lower rates will be great, but stability will be key. Lower rate volatility is more important than lower rates for the moment.
Context I’m watching
Bad news was good news — for an hour. A cool NFP with downward revisions turned everything green into the open, then markets went sellers. Historically it takes October 5 to 8 trading days to shake off September.
ES: 7805–7808.75 capped Friday. Low 7754 at 11:30, closed 7776.5 (up 52.5). Overnight high 7792.75 gave way at 9:45 PM; low 7761.5, now 7770.5.
Tens: NFP spike reversed. 105′08 high to 104′07 low, closed 104′11½. Bullish sentiment at 1.4% but off Monday’s lows; a stable overnight range of 104′14 to 104′18½.
Bitcoin: the Risk On/Risk Off tell. Friday’s spike to $87,765 reversed to $84,165, but the 9/21 consolidation holds above $82,350. Monthly point of control $84,360 below, volume shelf $90,000 above; stable rates and a peace catalyst could project to $100,000.
Reference prices are front-month futures, delayed, for general information only — not investment advice; confirm before acting.
Morning Note
The Most Important NFP Ever (Until Next Month)
Friday, October 2, 2026 · 5:45 AM ET
Reference · front-month futures · last price, delayed · change from exchange settlement
S&P 500 · ESZ26
7,761.50
+37.50
Nasdaq 100 · NQZ26
31,017.25
+256.75
Gold · GCZ26
$4,213.5
+11.20
Silver · SIZ26
$61.545
+0.370
2-Yr Note · ZTZ26
101′27¼
+0′00½
10-Yr Note · ZNZ26
104′23
+0′02
WTI · CLX26
$89.26
−3.61
Bitcoin (Micro) · MBTV26
$86,795
+1,770
S&P futures traded as low as 7672.75 yesterday morning and bounced into a small V reversal that has carried on through the overnight into European trading this morning. We find ourselves back at the 7765 point of control for the entire week. A fitting outcome for a tumultuous week that is capped off with the Employment Situation release by the BLS at 8:30 ET. Consensus estimates are for an increase in Non-Farm Payrolls of 89k, an increase in Average Hourly Earnings m/m of 0.3%, and an Unemployment Rate of 4.1%.
Yesterday’s recovery mid-session was driven in part by reduced expectations of an October rate increase by the Fed. A hot reading on the employment situation has the potential to turn those expectations back around and send stocks and bonds lower. A lukewarm to cool read is likely to put us into full Risk On mode. That said, those would be the normal expectations, but if there’s one thing we know, the market thrives on smashing expectations on jagged rocks.
Gold stayed in its new box yesterday and remained there overnight, although it does appear to be trading with a decent bid. It’s likely looking forward to the NFP numbers to make a break either way. Futures are currently up $14 to $4216.5 and appear eager to break higher.
Ten-year note futures have likewise traded in a narrow range overnight from 104′16 to 104′24½. They caught a bid the same time equities did yesterday and have been trading on the high side of this small range since. Notes are also trading at the week’s point of control at 104′20.
Oil had a spill overnight! Sorry, had to. Futures are trading down to $89.05, down $3.82 a barrel. It has done a full roundtrip in just over a day. 1:30 AM Thursday had WTI futures at $88.79. They rallied up to $93.70 at 2 PM, traded in a $1 range up there before somebody pulled the plug, and it plummeted sharply to $88.99 just at 5:20 this morning.
Everybody is focused on NFP this morning. As always it’s the most important NFP ever, but that’s until next month when it is supplanted by November’s release. Tune in next week for the next most important economic number release of all time. Next week isn’t going to compete on the economic numbers front, I’m afraid. It looks like the most anticipated number on the US calendar is the release of the minutes from the most recent rates meeting. For folks interested in Dot Plots, it’s big stuff. For the rest of us, what an opportunity to focus on the things that matter in life like Faith and Family.
If there’s one thing we know, the market thrives on smashing expectations on jagged rocks.
Context I’m watching
NFP at 8:30 ET. Consensus: payrolls +89k, Average Hourly Earnings +0.3% m/m, unemployment 4.1%. Hot risks reviving October rate-increase expectations and sending stocks and bonds lower; lukewarm to cool could mean full Risk On.
ES back at the week’s point of control. V reversal off yesterday’s 7672.75 low has carried through Europe to the 7765 weekly POC.
Gold in its box with a decent bid. Up $14 to $4216.5, waiting on NFP to break either way.
Tens at the weekly point of control. Overnight range 104′16 to 104′24½; trading on the high side, near the 104′20 POC.
Oil had a spill. A full roundtrip in just over a day: $88.79 Thursday at 1:30 AM, up to $93.70 at 2 PM, back to $88.99 at 5:20 this morning.
Next week is quiet. The Fed minutes are the main event.
Reference prices are front-month futures, delayed, for general information only — not investment advice; confirm before acting.
Morning Note
Lots of Chop and No Progress
Thursday, October 1, 2026 · 6:30 AM ET
Reference · front-month futures · last price, delayed · change from exchange settlement
S&P 500 · ESZ26
7,730.50
+15.00
Nasdaq 100 · NQZ26
30,862.50
+163.75
Gold · GCZ26
$4,192.2
+5.50
Silver · SIZ26
$60.915
+0.349
2-Yr Note · ZTZ26
101′20⅝
−0′00¼
10-Yr Note · ZNZ26
104′04½
−0′02
WTI · CLX26
$91.77
+1.35
Bitcoin (Micro) · MBTV26
$83,970
+45
The S&P ended Wednesday near its lows. S&P futures ended the New York session at 7705.5. Buyers came in after the closing bell and started to lift the market back up. This buying provided a steady bid all the way back up to a peak of 7767.5 at 2 AM this morning. Something seems to have snapped at that time, and futures turned abruptly lower all the way back to test the lows set at yesterday’s New York low, hitting 7704.75. Bids came back when the lights turned on in London, and we’re now back up to 7733.
Important levels to watch in the short to medium term are the monthly point of control at 7678.75 and another high-volume node that has been established up at 7765.25 on the same timeframe. Shorter term, we seem to be wallowing in a low-volume node no man’s land. Look for nearby resistance at 7743, 7767.5, and 7780 (all attainable in a day). Nearby support is the double bottom at 7705, and 7685. It gets ugly below here.
The last week in particular has drawn out a pretty choppy “pattern” that looks a lot more like consolidation than correction. See the hourly chart below for reference. It’s the first day of what is historically a good month and quarter, but expect the next two weeks to be critical in clearing September’s overhang and sorting out the leaders from the losers. For more interesting insight on what history shows, check out this post from The Stock Trader’s Almanac resident guru Jeff Hirsch about October.
E-mini S&P 500 (ESZ26), hourly, with the monthly volume profile — a week of chop between about 7705 and 7800 after the late-September high. Chart: NinjaTrader.
Gold was generally bid all day on Wednesday but never ventured too far above unchanged. Point of control for the week is $4189, and it seems comfortable trading in a range between $4250 and $4170 for the moment, although currently closer to the lows at $4183.
10-year Treasuries remain weak. It’s hard to conceive of any meaningful rally in stocks or metals without rates playing nice. Stocks are still nominally off of their all-time highs even in the face of 10-year yields at 5.29%. Some stabilization, at least, would probably be a green light for eager bulls to step into other markets.
Over the last week Oil has traded in a range of $89 to $96.75, and it has hit each of those twice. WTI currently finds itself trading near the middle of the range at $92. Like stocks over the same period, there’s a lot of chop but not much in the way of progress. That pretty much sums up so much of where we are in all things at the moment… Lots of chop and no progress. Let’s pray that the new month and new quarter will bring us some peaceful resolution to the conflict in Iran. Pray for humble leaders.
That pretty much sums up so much of where we are in all things at the moment… Lots of chop and no progress.
Context I’m watching
ES in a low-volume no man’s land. Overnight round trip from 7705.5 up to 7767.5 and back to 7704.75; now 7733. Resistance 7743, 7767.5, and 7780; support the 7705 double bottom, then 7685. It gets ugly below.
Monthly volume map. Point of control at 7678.75; high-volume node at 7765.25.
Consolidation, not correction. The next two weeks are critical for clearing September’s overhang and sorting leaders from losers.
Gold range-bound. Weekly point of control $4189; comfortable between $4170 and $4250, currently near the lows at $4183.
Rates hold the key. 10-year yields at 5.29%; stabilization would be a green light for eager bulls.
WTI mid-range. $89 to $96.75 over the last week, each hit twice; now about $92.
Reference prices are front-month futures, delayed, for general information only — not investment advice; confirm before acting.
Morning Note
Closing the Books on the Quarter
Wednesday, September 30, 2026 · 5:30 AM ET
Reference · front-month futures · last price, delayed · change from exchange settlement
S&P 500 · ESZ26
7,742.00
+10.00
Nasdaq 100 · NQZ26
30,621.00
+7.75
Gold · GCZ26
$4,215.8
+36.10
Silver · SIZ26
$61.220
+0.067
2-Yr Note · ZTZ26
101′22
+0′00⅞
10-Yr Note · ZNZ26
104′18½
+0′05
WTI · CLX26
$90.42
+1.04
Bitcoin (Micro) · MBTV26
$83,715
−225
Stocks generally traded weak all day Tuesday. S&P 500 futures traded down to 7712.25 at 1 PM and bounced higher into the close to settle 7738.25, down 8.5 points. Overnight has brought a healthy 20+ point range from 7733.75 to 7756.5, all of which occurred during the first hour of European trading. Currently we are trading 7748.50. That level has served as support and resistance a few times over the last week.
Today is the last day of the Quarter. It brings us the Core PCE Price Index and Final GDP at 8:30. Traders will be looking at those numbers for any possible reading of inflation. The Core PCE Price Index will likely carry more weight than normal. It is known as the Fed’s primary inflation measure. CPI drives headlines, but PCE is where the nerds live. Forecast is for a 0.3% M/M increase. Final GDP is for the 2nd quarter. This will be the 3rd and final time we get a read on 2Q economic activity. Consensus estimates are for 1.5% GDP growth annualized. Look for support to come in at 7712.25 and 7677.25. To the upside, look for resistance to be tested at 7774 and 7810.
Gold shook off some of the rust from the previous session and rallied 1.12% on the day to close at $4215. Silver lagged Gold noticeably all day and ended the session up only 12.5 cents to $61.845. Overnight has seen a choppy but generally positive bias. Gold is currently up $10 to $4225. Silver is playing along in sympathy, but it is lacking any real spark. Metals appear to be in repair and recovery mode after the rough day they had on Monday. For the moment Gold looks to be the more constructive of the two. Most notable for Gold’s action on Tuesday was the huge spike and reversal in the US Dollar Index. Gold is typically more sensitive to movements in the Dollar than it showed yesterday. Glimmers of hope? Can we be allowed at least that?
Note futures were a little feisty on the day, trading as high as 104′22½ and as low as 104′05½. They settled 104′17, up 1.5 ticks. Yields aren’t pretty (5.226% currently), but at least traders could catch their breath. Today’s GDP and PCE inflation numbers and NFP on Friday are nearby, so I expect Treasuries will tread some water here waiting for those numbers to be released. Currently trading 104′18.
WTI futures were weak all session and settled down $3.66 at $88.94. Normally a selloff like that would have given a bigger lift to the other markets, but I think everybody knows the real driver is yields. Overnight has been pretty quiet for oil, but bids did come in on the European open to push it higher by about $1. Currently trading $90.50.
This last week of the Quarter has been exhausting and living up to its reputation for being unpleasant. I think everybody would like to close the books on it and move on. Looking forward, there will likely be some residual overhang for the first week or two, but historically by mid-October we should be entering a very bullish phase. Let’s see how today settles and move forward.
Looking forward, there will likely be some residual overhang for the first week or two, but historically by mid-October we should be entering a very bullish phase.
Context I’m watching
Core PCE and Final GDP at 8:30. Core PCE, the Fed’s primary inflation measure, forecast +0.3% M/M; Final 2Q GDP consensus 1.5% annualized. NFP Friday.
ES at a pivot. Trading 7748.50, a level that has served as support and resistance a few times this week. Support 7712.25 and 7677.25; resistance 7774 and 7810.
Metals in repair and recovery mode. Gold up $10 to $4225 and the more constructive of the two; Silver playing along but lacking spark. Gold shrugged off Tuesday’s spike and reversal in the Dollar Index.
Treasuries catching their breath. Settled 104′17 after a 104′05½–104′22½ day; now 104′18. Yield 5.226%. Expect some water-treading ahead of the numbers.
WTI: yields are the real driver. Settled down $3.66 at $88.94 without lifting other markets; about $1 higher on the European open at $90.50.
Reference prices are front-month futures, delayed, for general information only — not investment advice; confirm before acting.
Morning Note
Taking Stock After the Blast
Tuesday, September 29, 2026 · 5:10 AM ET
Reference · front-month futures · last price, delayed
S&P 500 · ESZ26
7,743.75
−3.00
Nasdaq 100 · NQZ26
30,584.75
+18.50
Gold · GCZ26
$4,173.6
+5.20
Silver · SIZ26
$60.995
−0.723
2-Yr Note · ZTZ26
101′18
−0′01¼
10-Yr Note · ZNZ26
104′14
−0′01½
WTI · CLX26
$92.51
−0.09
Bitcoin (Micro) · MBTV26
$84,140
+350
Overnight the S&P 500 futures have steadied after a pretty rocky day yesterday, driven almost entirely by Rates and Oil. They leaked lower from the Asian open down to 7716 at 1:30 this morning and then caught some bids up to 7754.75 by 3:30 AM. We are currently trading near yesterday’s close at 7744. Yesterday’s gyrations were driven by the interplay between WTI, Rates, the Dollar, and a Trump afternoon presser cloud of worry. Of note, we’re still counting the days since the last time the S&P had a greater than 1% correction on a closing basis. That clock is still ticking and is up to 42 days.
Metals bore the brunt of yesterday’s Rates/Dollar/Oil trifecta. Gold was down over 3.5% and Silver down over 4.5%. There has been some real technical damage done here, with some technical levels and patterns broken. All major moving averages have rolled over and are pointing down. It’s going to take some time to fully assess the situation, especially if one wants to try to find any reason to remain bullish metals. Yesterday’s note mentioned that $4100 was the next technical support level. Gold traded down to $4,143 yesterday and left that level intact. Overnight some weak buying has come in and Gold has pushed back up to $4180. That was the support level that was about to give way at this time yesterday. It is now minor overhead resistance.
5.247% is the current 10-year Treasury yield. It traded as high as 5.27% intraday. This is the market that is driving all others right now. It is being fueled in large part by continued high-priced crude oil. These two do not mix well. After trading as low as 104′08 yesterday, ten-year Treasury futures have steadied off their lows and are currently trading 104′13½. Yesterday certainly had that capitulatory feel. There was much crying out, gnashing of teeth, and rending of garments, but after a few hours of overnight calm, maybe we aren’t there yet.
WTI futures for November traded as high as $96.54 yesterday before falling off to $91.25. After hitting that low, WTI bounced to settle $93.29, and continued that bounce through Asia, up to $94.88. European trading finds WTI pulling back again and showing some signs of weakness, down to $92.55.
Overall, it looks like all of these markets are taking stock of yesterday’s blast of volatility and assessing the situation. Just two more days in the quarter, GDP and NFP to go. What could go wrong? We could get some strange activity as quarter-end positioning kicks into gear, but chances are that the last couple of days this week will be tempered as the market waits for NFP, but that’s just a guess. Anytweet can happen.
Overall, it looks like all of these markets are taking stock of yesterday’s blast of volatility and assessing the situation.
Context I’m watching
ES steadied overnight. Leaked to 7716 at 1:30 AM, bid back to 7754.75 by 3:30 AM, now near yesterday’s close. 42 days and counting without a 1%+ closing decline.
Metals: real technical damage. Gold down over 3.5% and Silver over 4.5% yesterday; all major moving averages rolled over. Gold held $4100 (low $4,143) and is back to $4180, now minor overhead resistance.
The 10-year is driving everything. Yield 5.247% after a 5.27% intraday high, fueled by high-priced crude. Tens steadied off the 104′08 low, now 104′13½.
WTI whipsaw. $96.54 high to $91.25 low, settled $93.29, bounced to $94.88 in Asia, now back to $92.55.
Quarter-end week. Two sessions left in the quarter, then GDP and NFP. Possible quarter-end positioning, likely tempered ahead of NFP.
Reference prices are front-month futures, delayed, for general information only — not investment advice; confirm before acting.
Morning Note
Look Over There, Not Here
Monday, September 28, 2026 · 5:00 AM ET
Reference · front-month futures · last price, delayed
S&P 500 · ESZ26
7,760.25
−43.50
Nasdaq 100 · NQZ26
30,537.75
−351.50
Gold · GCZ26
$4,174.6
−146.60
Silver · SIZ26
$61.475
−3.326
2-Yr Note · ZTZ26
101′19⅝
−0′03⅛
10-Yr Note · ZNZ26
104′16½
−0′11
WTI · CLX26
$95.60
+3.19
Bitcoin (Micro) · MBTV26
$83,080
−1,340
Here we go. Entering the last few trading sessions of the quarter. S&P 500 futures had a choppy open on Friday with a quick flush down to 7748.5. That reversed quickly at 10:15, and with some fits and starts ended the session at 7803.75, 36.75 points higher. The S&P ended the week higher by 91.25 points, with all-time highs just 44.75 points away at 7848.5.
Asian markets traded weaker with a small amount of chop. ES worked its way down to an overnight low of 7765, just below the weekly point of control of 7772. European markets are steady near those lows early in that session. If we continue lower, look for support at 7769, and then lower look for toeholds at 7748.5, 7722, and 7710. Up the ladder, look for resistance to come into play at 7795, 7811, 7838, and finally 7848.5. There is a lot going on this week. All week we have a continued parade of FOMC speakers, Wednesday brings Final GDP, and Friday the most important NFP since the last NFP and until the next NFP.
Gold ended the week down $103.70 at $4321.2, and it is getting clobbered this morning. It looks like the continued barrage of hits from a strengthening USD, weaker bonds, and higher WTI is too much for it to carry this morning. Gold is down 3.3% to $4179, and Silver is down an eyebrow-raising 5.3% to $61.36.
Gold is currently trading $4181, and meaningful support doesn’t come in until about $4100 if it can’t hold here. Given the trajectory of this push from the Sunday night open until early Europe, it doesn’t look like $4180 stands a chance. Below that we’re looking at $4000 and $3975. This looks and feels capitulatory. Take a look at the trajectory on the chart below. The question becomes how much damage is done. Good time to sit back and watch it play out before trying to make any assessment, but keep in mind that there doesn’t appear to be any real catalyst here except a Trump speech scheduled for 2:00 PM ET. Much conjecture, no facts that I have seen.
Gold (GCZ26) with volume profile — from the Sunday night Globex open through 5 AM, a near-vertical drop through $4,324 into thin volume below. Chart: NinjaTrader.
WTI futures continue to amaze and entertain during their tour as the market’s favorite circus sideshow, but Treasuries, and by extension the Dollar, hold the secrets to the magic tricks. Look over there, not here.
Ten-year note futures took a scary spill off of the tightrope, but managed to end the week off of lows (104′14½). Is the top in for rates? It’s anybody’s guess, but I have to keep coming back to the fact that Treasuries are at record low bullish sentiment (9%), and yields are at multi-decade extremes (5.228%). All that said, they are 11 ticks lower this morning at 104′16½, just below Friday’s lows of 104′17. Things do not look good here, and maybe that’s just what we need. Like Gold, it’s a good time to sit back and watch for a little bit.
Sideshow star WTI traded in a fairly narrow range on Friday, about $3, and settled $92.41. This morning finds it almost $3 higher at $95.41. $95.50 has shown some resistance previously, but $96.79 will be the real test. It was the peak reached last week before turning sharply lower. Given the trajectory of the move this morning, it looks like those should be easy hurdles on the way back to test $100 in the near term.
Treasuries, and by extension the Dollar, hold the secrets to the magic tricks.
Context I’m watching
ES: testing the weekly point of control. Overnight low 7765, just below the 7772 weekly POC. Support 7769, then 7748.5, 7722, and 7710; resistance 7795, 7811, 7838, and all-time highs at 7848.5.
A busy week. FOMC speakers all week, Final GDP Wednesday, NFP Friday, and the last sessions of the quarter.
Gold and Silver getting clobbered. Gold down 3.3% to $4179, Silver down 5.3% to $61.36. Meaningful support not until about $4100, then $4000 and $3975. Looks and feels capitulatory; the only scheduled catalyst is a Trump speech at 2:00 PM ET.
Treasuries hold the secrets. Tens 11 ticks lower at 104′16½, just below Friday’s 104′17 lows. Record low bullish sentiment (9%) against multi-decade-high yields (5.228%).
WTI back on the tightrope. Settled $92.41 Friday, now $95.41. Resistance $95.50, then the real test at last week’s $96.79 peak, with $100 in sight.
Reference prices are front-month futures, delayed, for general information only — not investment advice; confirm before acting.
Morning Note
Steady After a Near-Death Scare
Friday, September 25, 2026 · 4:30 AM ET
Reference · front-month futures · last price, delayed
S&P 500 · ESZ26
7,783.75
+16.75
Nasdaq 100 · NQZ26
30,923.00
+156.25
Gold · GCZ26
$4,319.3
+21.30
Silver · SIZ26
$64.610
+0.608
2-Yr Note · ZTZ26
101′21⅛
+0′00¼
10-Yr Note · ZNZ26
104′28½
+0′01
WTI · CLX26
$93.25
−1.36
Bitcoin (Micro) · MBTV26
$84,895
−15
European open finds the S&P 500 futures trading near yesterday’s session high of 7783.5, currently 7778. Yesterday felt like it could be shaping up to be bad news. Dark clouds were overhead in the form of an ominous rates outlook and climbing oil prices. Those clouds largely dissipated by the lunch hour and buyers stepped in to boost equities. S&P futures surged from trough (7730) to peak (7783.5) in about 30 minutes, fell back to VWAP around 7750, and bounced around for the remainder of the session, ending at 7767.
Overnight, Asia tested 7750 and bounced into a choppy climb higher throughout the night. We have durable goods orders news due at 8:30. It’s usually not a big market mover, but neither was PMI supposed to be. In short, we’re looking steady to slightly higher after yesterday’s near death scare. Just about past the September graveyard, and it seems everybody is looking over their shoulders until we’re clear of the quarter. For today, look for both support and resistance right here at yesterday’s high, 7783.5. Overhead, watch 7838 with keen interest. It is the point of control for the week and resides just below all-time highs (7848.5). Support below should come in at 7760, 7748, 7710, and 7675.
Gold and Silver are in a similar state as they were in yesterday. Steadier than they should be given the rates, dollar, and crude oil storms swirling about them. Gold futures are currently up $11.1 to $4309.1, and Silver futures are up $.06 to $64.06. Steady and consolidating near recent lows. Always tough to get a read, but I’ll step back out there and reiterate that on a relative basis these metals are probably hanging in better than would normally be expected. If and when we get back to an all systems go situation, I’d expect them to show some leadership, barbarous relics that they are.
Ten-year futures are treading water at 104′27, with two-year futures trading 101′21. Yesterday was a rollercoaster for bonds. By the time we made it to the NY open they were trading at highs around 105′09. They sold down pretty hard to 104′24½, bounced a bit, and resumed downward to 104′14½ near the end of the session. Overnight and into the European session this morning, ten-year futures have retraced about 50% of yesterday’s range. Translated into a number anybody cares about, the yield is now 5.167% (after peaking at 5.221%). Steady, but tenuous. I don’t give enough attention to two-year rates, but they are currently 4.901%. Only 26.6 basis points separating the two-year from the ten-year yield. People are starting to feel a little edgy about this. Stay tuned for more yield curve talk on a television near you.
Crude oil is printing down about a dollar at the moment at $93.63. This is in the middle of the recent range for the November contract. Yesterday’s high was $96.79, which came after a bounce from lows set Tuesday this week at $88.71. Point of control for the past month sits nearby at $92.15. The minute-to-minute volatility in crude oil is easy for other markets to fixate on. Dialing the timeframe back a couple of degrees, we find ourselves trading right in the middle of the range for the month, roughly $81 to $107, or $26. Half of that is $13, and that gets us to $94! Numbers magic! Steady.
Bitcoin has inched lower and is pulling its consolidation zone down with it, from $86,000 to $85,000. Not much to comment on here, but keeping watch.
In short, we’re looking steady to slightly higher after yesterday’s near death scare.
Context I’m watching
ES: yesterday’s high is today’s pivot. Support and resistance both at 7783.5. Overhead, the week’s point of control at 7838 sits just below all-time highs (7848.5); support 7760, 7748, 7710, and 7675. Durable goods at 8:30.
Metals hanging in better than they should. Gold up $11.1 to $4309.1, Silver up $.06 to $64.06, consolidating near recent lows. Expect leadership when we get back to all systems go.
Treasuries: steady, but tenuous. Tens at 104′27 have retraced about 50% of yesterday’s 105′09 to 104′14½ range; the yield is 5.167% after peaking at 5.221%. Only 26.6 basis points separate the two-year (4.901%) from the ten-year.
Crude: numbers magic. $93.63, mid-range for November between Tuesday’s $88.71 low and yesterday’s $96.79 high. The month’s point of control is $92.15, and the monthly range of $81 to $107 puts its midpoint at $94.
BTC: consolidation zone drifting lower. From $86,000 to $85,000. Keeping watch.
Reference prices are front-month futures, delayed, for general information only — not investment advice; confirm before acting.
Morning Note
Whistling Past the 5% Yield Graveyard
Thursday, September 24, 2026 · 5:30 AM ET
Reference · front-month futures · last price, delayed
S&P 500 · ESZ26
7,719.00
−53.50
Nasdaq 100 · NQZ26
30,398.75
−366.00
Gold · GCZ26
$4,290.4
−28.00
Silver · SIZ26
$64.015
−0.949
2-Yr Note · ZTZ26
101′20⅝
−0′00⅛
10-Yr Note · ZNZ26
104′29½
−0′03½
WTI · CLX26
$93.91
+1.75
Bitcoin (Micro) · MBTU26
$83,235
−1,260
S&P futures were weak all session on Wednesday. They were tipped over the ledge shortly after the NY open by Flash Manufacturing and Services PMIs, which came in hotter than forecast. These are not typically market-moving numbers, but when markets are consolidating and getting wound up looking for some direction, sometimes the smallest spark is all the catalyst they need to break. S&P futures traded all the way down through the first support level noted yesterday and bottomed at 7758. They chopped around the 7765 to 7775 area for most of the afternoon. Any attempt at a rally was capped below VWAP.
Overnight, futures continued trading around 7765.50 until about midnight, when they began trickling lower. We now find ourselves trading 7724.5. 7722 was cited yesterday as an area of possible support. So far we’re holding here, but with crude trading higher and bonds continuing lower there isn’t any real reason for this support to be more than a resting spot. Look to 7686 as the next likely support, with the 7600 to 7587 zone below that. If we can turn this ship around and move higher, look for resistance up at previous highs of 7739, 7765, and 7782.
The Gold and Silver consolidation didn’t resolve to the upside as expected. When yields and the dollar gapped higher, they gapped lower. $4330, cited yesterday as support, finally gave way on the PMI numbers and Gold chopped down to the $4310 area. Weakness continued overnight through Asia and into Europe. Gold is currently trading $4293. At the moment the only positive thing to say is that things don’t look as bad as they probably should look given the move in rates, but I’ll leave it at that for now. There are a few small toeholds between here and $4200, but nothing worth mentioning. Real volume support doesn’t enter the picture until about $4100. Let’s hope we’re not talking about that level tomorrow at this time!
Treasuries are the top story here. The PMI numbers kicked the complex over. Support had been tenuous and everybody was whistling past the 5% yield graveyard, but yesterday’s break was… lifted… removed. Ten-year futures had been trying to trace out some support at the 106 handle, but we now find ourselves trading 104′30. In yield terms we’re at 5.139%. That level hasn’t been seen for about 22 years. Take yesterday’s mention of stabilizing rates and forecasts and toss them. There are no support levels to look to here. All we can hope for is that this is what capitulation looks like. Although, I read a comment from yesterday from a market-savvy person that said the capitulation happens when people stop talking about the capitulation. Ouch! Truth.
Crude traded higher all session on Wednesday, but not with the same energy (sorry) that was driving Yields and Metals. November WTI was up $1.64 to $92.16 and is currently up another $1.60 this morning to $93.76. Nothing to sneeze at, but tame given the developments mentioned in the other markets and well off recent highs.
Our new friend Bitcoin was not immune to developments in the other assets. Sometimes we’re all oil traders and sometimes we’re all rates traders. Yesterday was obviously the latter. BTC futures went from a high of $87,380 down to $84,000 in the course of about 12 hours yesterday, in a pretty relentless fashion. It bounced around the $84k handle for most of the day and has since resumed its push down to $83,000. Next minor levels come in at the big round numbers, with Point of Control for the month at $79,000. Similar to Gold and Crude, the only real glimmer at the moment is a general sense of “it’s not as bad as it could be.” Not the best place to find oneself in the markets, but it’s what we’ve got.
All we can hope for is that this is what capitulation looks like.
Context I’m watching
Treasuries are the top story. Hot Flash PMIs broke the 106 handle; tens trade 104′30, about 5.139% in yield. No support levels to look to here.
ES: 7722 is a resting spot, not a floor. Wednesday bottomed at 7758 and overnight trickled to 7724.5. Next support 7686, then the 7600–7587 zone; resistance 7739, 7765, and 7782.
Gold: $4330 gave way. Trading $4293, with only small toeholds down to $4200. Real volume support doesn’t enter until about $4100.
Crude higher, but tame. November WTI up $1.64 to $92.16 Wednesday and another $1.60 this morning to $93.76 — still well off recent highs.
BTC: we’re all rates traders today. A relentless slide from $87,380 to $84,000, now pushing $83,000. Next levels at the big round numbers; the month’s point of control is $79,000.
Reference prices are front-month futures, delayed, for general information only — not investment advice; confirm before acting.
Morning Note
Toying With All-Time Highs
Wednesday, September 23, 2026 · 5:30 AM ET
Reference · front-month futures · last price, delayed
S&P 500 · ESZ26
7,836.50
+4.75
Nasdaq 100 · NQZ26
31,024.50
−4.00
Gold · GCZ26
$4,351.5
−24.90
Silver · SIZ26
$65.85
−0.680
2-Yr Note · ZTZ26
101′28⅜
+0′00⅛
10-Yr Note · ZNZ26
106′01½
+0′01½
WTI · CLX26
$90.12
−0.40
Bitcoin (Micro) · MBTU26
$85,895
−395
S&P 500 futures ended the session Tuesday 7,831.75 (−1.75 points). There was a decent trading range for such a small net difference. The 7,848.50 high printed just after the NY open and the market chopped lower to 7,822.50 by 11:40. Futures then began the roundtrip back up to just off the highs at 7,846.50 at 3:50 PM. In the last few minutes a slew of sell orders sliced about 15 points off in a matter of minutes. Overnight was quiet with hardly a blip in Asia and into Europe. Low 7830 and high of 7842. Tightest overnight in recent memory.
Point of Control for the week is 7838.5 and we have been pegged to it. Look for support 7763 (minor), 7722 and 7688.5. There is only one spot of resistance left at 7848.5. We have formed a double top there and are toying with All Time Highs. The sky is the limit after a push through there. Nasdaq 100 futures are similarly poised for All Time Highs. Russell 2000 and Dow Jones Industrials have some catching up to do to join the party. Seeing the relative weakness of Russell and Dow futures is a reminder that the rally still has a good amount of sector rotation under the surface, and that NDX and SPX are being led by Tech names. Two more cautionary signals to be aware of are VIX, which is trading down around 17.5, and the number of sessions without a 1% decline in the S&P 500, which is up to 38.
Gold and Silver traded weaker most of Tuesday until Gold found some buyers and began inching upwards. Silver lagged behind only to overtake its sibling by the close. Gold closed the session modestly lower at $4376.4 (−7.5) and Silver closed modestly higher at $66.53 (+0.115). Late session buying in the pair carried into Asia, which saw prices climb slowly to $4408 before turning lower. We are currently trading right in the middle of yesterday’s 100 point range at $4355. Look for minor overhead resistance at $4410 and $4440. Support comes in $4330 and $4273. Point of control is $4400. The ranges in Gold and Silver are sleep inducing, but this is the consolidation before the next move. Direction is anybody’s guess, but if rates and oil remain stable it would seem the next breakout should be higher.
Like metals, the Ten year and Two year futures have become rangebound the last couple of sessions. Stable rates are good. They allow for more informed forecasts. The question now is whether this stall and consolidation is building energy for a turn higher (lower yields) or lower. As ineffectual as administration jawboning and Treasury fiddling are, one has to believe they are going to do everything they can to keep a lid on rates from here. They want to keep rates out of the headlines in the runup to the midterms at the very least.
For Crude oil a picture is worth a thousand words. Chart of the day. No fancy indicators or other doodads necessary. I will add that the Energy and Oil Production and Services stocks have done a great job of leading this move lower. They led crude higher late last year before the war, and were showing weakness well ahead of crude prices on this turn lower.
WTI crude oil (CLX26) — a week of stair-step selling from about $102 down to the $89–$90 area. No indicators needed. Chart: NinjaTrader.
Bitcoin! Holding strong near recent highs of $87,465. Currently consolidating around $86,000. Maybe time for a little breather before the next leg to $100,000.
We have formed a double top there and are toying with All Time Highs. The sky is the limit after a push through there.
Context I’m watching
ES: one spot of resistance left at 7848.5. A double top there, with All Time Highs in reach. Support 7763 (minor), 7722 and 7688.5. The week’s point of control is 7838.5 and we have been pegged to it.
The tightest overnight in recent memory. Low 7830, high 7842, hardly a blip in Asia or Europe — after Tuesday’s wide chop and a 15-point slice in the last few minutes.
Sector rotation under the surface. Nasdaq 100 is poised for All Time Highs too, but Russell 2000 and the Dow have catching up to do. NDX and SPX are being led by Tech names.
Two cautionary signals. VIX is trading down around 17.5, and the S&P 500 has now gone 38 sessions without a 1% decline.
Metals: sleep-inducing ranges. Gold closed $4376.4 and Silver $66.53. Resistance $4410 and $4440; support $4330 and $4273; point of control $4400. If rates and oil stay stable, the next breakout should be higher.
Rates rangebound, and likely by design. Stable rates allow for more informed forecasts — and they will do everything they can to keep rates out of the headlines into the midterms.
Crude: the chart says it. Energy and Oil Production and Services stocks led this move lower, just as they led crude higher late last year before the war.
BTC: a breather near the highs. Holding near $87,465 and consolidating around $86,000, before the next leg to $100,000.
Reference prices are front-month futures, delayed, for general information only — not investment advice; confirm before acting.
Morning Note
Sell Rosh Hashanah and Buy Yom Kippur!
Tuesday, September 22, 2026 · 5:00 AM ET
Reference · front-month futures · last price, delayed
S&P 500 · ESZ26
7,833.75
+0.25
Nasdaq 100 · NQZ26
30,786.75
+2.00
Gold · GCZ26
$4,367.8
−16.10
Silver · SIZ26
$66.06
−0.355
2-Yr Note · ZTZ26
101′29½
+0′01½
10-Yr Note · ZNZ26
106′07
+0′05½
WTI · CLX26
$90.36
−2.01
Bitcoin (Micro) · MBTU26
$86,290
−300
S&P futures put in a rally for the record books Monday (+1.57%). When we left off, ES was trading 7762. A few hours earlier that level marked resistance on a chart of higher degree. It quickly became the support area as the market awaited the NY equity market open. On the attached chart you can see that there was some selling pressure going into 9:30. This was just enough pressure to have traders wondering if overnight promises were about to be broken by New York light of day.
With Crude oil getting smacked lower (−3.86%) and bonds holding steady, big buyers stepped up in force. Next up on the resistance ladder was 7782.50. Buyers sliced through that easily and proceeded to rally without any real pause until reaching the ultimate peak at 7847 at 3:41 PM. 7838.5 was the last projected resistance for the day, and I was amazed we made it there. Interestingly, enough volume transacted around that price to pull the Point of Control for the entire session up to 7836.5.
E-mini S&P 500 (ESZ26), Monday’s session with volume profile — 7763 resistance becomes support, 7782 taken out easily, high 7847; session point of control 7836.50. Chart: NinjaTrader.
Overnight, the Asian session opened steady as everybody caught their collective breath at the 85+ point rally that happened earlier. Futures have only been able to get as high as 7839.5 since. Yom Kippur has passed and the sellers have arrived. It looks like we are back to a two-way market today. S&P futures have trailed off steadily, but not too sharply, from 7837 to a low of 7810.50 so far. Crude and bonds are relatively unchanged this morning, so there is no real catalyst for the weakness except a return to reality. Look for support at 7788.50, 7763.50, and 7738.50. Below that and we’re back into the previous week’s levels, 7700 and 7693. Overhead, look for resistance at yesterday’s high of 7847 and then 7905.
E-mini S&P 500 (ESZ26), overnight into Tuesday morning — a quiet 7830–7840 range overnight, then an early-London dip to 7810.50 and a quick rebound. Chart: NinjaTrader.
As I’ve been writing, buyers have come back in to lift the S&P off its lows and back up to 7833. This is shaping up to be a good, wide-ranging, two-sided market today. Go team price discovery!
Metals and Bonds were both lackluster on Monday. Bonds had a steady bid, while it seemed like all anti-fiat currency demand shifted from the metals to Bitcoin. Gold traded weak all day and ended $4,383.90. Silver likewise was off about 1% and settled $66.415. Ten-year notes settled up 7.5 ticks at 106′01½, and Two-years settled unchanged at 101′28.
Yesterday we showed a chart of the MBTU6 (Micro Bitcoin September future) that showed the rally that was underway in the early morning hours before New York turned on the terminals. That rally continued throughout the day, with BTC up from where we left off at $84,300 all the way up to $87,465 before pulling back on the close to $86,590. That market appears to be entering consolidation mode. It’s trading $86,280, down $310.
This is shaping up to be a good, wide-ranging, two-sided market today. Go team price discovery!
Context I’m watching
ES: back to a two-way market. After Monday’s +1.57% run to 7847, overnight highs stalled at 7839.5 and London dipped to 7810.50 before buyers lifted it back to 7833. Resistance 7847, then 7905; support 7788.50 ⇒ 7763.50 ⇒ 7738.50, then the previous week’s 7700 and 7693.
Session point of control pulled up to 7836.5. Enough volume traded near the 7838.5 last projected resistance to drag Monday’s point of control up with it.
Crude smacked lower, bonds steady. Crude oil fell 3.86% Monday while bonds held a steady bid — the backdrop for the big buyers stepping in.
Metals lackluster. Gold ended $4,383.90 and Silver settled $66.415, off about 1%, as anti-fiat demand seemed to shift to Bitcoin.
Treasuries. Tens settled up 7.5 ticks at 106′01½; twos unchanged at 101′28.
BTC: entering consolidation mode. Up from $84,300 to $87,465 Monday before pulling back on the close; trading $86,280 this morning.
Reference prices are front-month futures, delayed, for general information only — not investment advice; confirm before acting.
Morning Note
Everything Lined Up Nicely
Monday, September 21, 2026 · 5:00 AM ET
Reference · front-month futures · last price, delayed
S&P 500 · ESZ26
7,761.75
+49.25
Nasdaq 100 · NQZ26
30,248.00
+330.75
Gold · GCZ26
$4,391.0
−33.90
Silver · SIZ26
$66.725
−0.424
2-Yr Note · ZTZ26
101′29⅜
+0′01¼
10-Yr Note · ZNZ26
106′02½
+0′08
WTI · CLX26
$94.19
−1.89
Bitcoin (Micro) · MBTU26
$84,095
+2,765
S&P 500 futures have seen steady buying from Asia and into Europe early this morning. The S&P has passed Friday’s Europe high and is sitting at the next level of overhead resistance (7762).
S&P 500 futures top-ticked Friday’s session at 7739.25 near the European open and proceeded to trade down through the overnight to a low of 7675 at 12:30 ET. From there the buyers came in and kept a slow but constant pressure on the market all the way into the 4 PM NY close (7712.5), then on to the futures close one hour later (7725).
Although ES finished off of early-session highs, the afternoon rally seemed like it had legs to keep on going if given more time. It’s always difficult to read the effect that Triple Witching (futures and options expiration) has on a given day, except that they tend to be high-volume days, with hedges being settled and positions rolled forward.
Looking at the week ahead, it is very light on economic releases, but there are some scattered speeches scheduled for Fed Governors. It should be a technical trader’s market. Levels to watch in the near term for S&P futures: overhead resistance 7739 ⇒ 7763 ⇒ 7782.5 and 7838.5. Support below should come in at 7675 ⇒ 7645 ⇒ 7620 ⇒ 7586.
Metals are very strong on a technical basis, especially given the higher-yield, higher-oil, and strong-USD environment they have been weathering for weeks. Dollar Index futures rallied from 98.30 to 100.28 between 9/9 and 9/18, and Gold and Silver took it in stride. Gold broke the $4300 support briefly on the FOMC number last week but quickly recovered all the way up to $4440, and looks to be gearing up for a run at $4500. It is currently $4400, having eased off of Asia highs around $4440. Also keeping an eye on Silver here to confirm any real breakout in precious metals. When the higher beta of the two catches fire, it can run hard. With Silver currently trading $66.81, look for overhead targets at the bucks: $68, $69, and $70.
Treasury futures, both 10s and 2s, which had been mostly bid Thursday, finally seemed to succumb to higher-rate reality and ended Friday on or near lows. Sentiment is still bleeding lower, with Bulls in the single digits and at extremes. Still wondering who is left on the bull side of the trade aside from Treasury. Sentiment is always a poor timing tool, and it’s definitely proving it with bonds, but it still seems like something has to give here. There just isn’t anything on the charts to latch onto here. Bonds are going to have to find their own way to build some kind of support ledge. As of this writing, 10-year note futures do appear to be finding some support in the 105′21 to 105′24 range. Asia and Europe both find notes off of Friday’s lows and trading up at 106′02½.
With no real developments on the war in Iran, Crude oil futures traded in a “narrow” $3 range on Friday: high $98.02 near the NY open and down to $95.15 near the close. WTI futures are weaker overnight and traded as low as $93.45 before bouncing to the current $94.17.
Bitcoin! Let’s talk about something fun for a change. How about a $6k rally between 8 PM ET on Thursday and 11 AM ET Saturday morning? BTC futures for September started at $76,245 Thursday night, traded steadily higher to $77,500 to catch a breath, and then blasted off from $80,000 Friday morning at 9 AM ET until finally hitting $82,065 14 hours later. That rally has continued unabated in overnight trading. Sunday night saw BTC futures consolidating gains in the $81,000 to $82,000 area before blasting off in London trading. Currently trading $84,300!
Micro Bitcoin (MBTU26) with order-flow volume profile — breaking out above 81,090 after a month-long range; point of control 78,080. Chart: NinjaTrader.
As mentioned in previous entries, I have been keeping an eye on BTC as a gauge of Risk On sentiment and appetite. Historically, the last week of September is the weakest for equities, but history hasn’t been the best guide this quarter. This chart of BTC is showing clear signs of Risk On and FOMO. As of this morning, this appears to be panning out. Time will tell, but everything is lined up nicely. Equities, Bonds, and BTC are Green, Crude is Red, and the Metals are Yellow (we prefer “consolidating”).
Equities, Bonds, and BTC are Green, Crude is Red, and the Metals are Yellow (we prefer “consolidating”).
Context I’m watching
ES: sitting at 7762 resistance. Past Friday’s Europe high after steady buying from Asia into Europe. Overhead 7739 ⇒ 7763 ⇒ 7782.5 and 7838.5; support 7675 ⇒ 7645 ⇒ 7620 ⇒ 7586.
A technical trader’s week. Very light on economic releases, with scattered Fed Governor speeches — and Friday’s Triple Witching now behind us.
Gold eyeing $4500; Silver the confirmation. Gold shrugged off a stronger dollar (DX 98.30 to 100.28) and eased from Asia highs near $4440. Silver targets at the bucks: $68, $69, $70.
Tens: a support ledge at 105′21–105′24? Friday ended on or near lows, but notes are up at 106′02½ in Asia and Europe. Bulls in the single digits.
Crude: weaker overnight. A $3 range Friday ($98.02 to $95.15), then as low as $93.45 overnight before bouncing to $94.17.
BTC: Risk On and FOMO. A $6k rally from $76,245 Thursday night, and a London-session breakout from $81,000–$82,000 to $84,300 — against the last week of September’s weak history for equities.
Reference prices are front-month futures, delayed, for general information only — not investment advice; confirm before acting.
Morning Note
A Tailwind Into Friday
Friday, September 18, 2026 · 4:30 AM ET
Reference · front-month futures · last price, delayed
S&P 500 · ESZ26
7,729.50
+22.25
Nasdaq 100 · NQZ26
29,920.75
+177.75
Gold · GCZ26
$4,429.8
+30.10
Silver · SIZ26
$67.61
+1.515
2-Yr Note · ZTZ26
101′30⅝
−0′00¾
10-Yr Note · ZNZ26
106′04
−0′01½
WTI · CLX26
$95.49
−1.74
Bitcoin (Micro) · MBTU26
$78,065
+1,460
Equities continued their post-FOMC bounce and spent all session bid and consolidating back above 7700. Early Asia saw S&P futures continue this consolidation until bids finally came back in around 11 PM. Futures are now trading at session highs at 7737. It’s early, but maybe 7720 will act as support. Next overhead resistance is just 30 points higher at 7765. Below, 7700 has built a good volume shelf, with the point of control for the month just below at 7680.
E-mini S&P 500 (ESZ26), 60-minute with volume profile — trading above the triangle’s upper edge and the 7720 line; point of control 7680. Chart: NinjaTrader.
Gold and Silver also breathed a sigh of relief with FOMC in the rearview mirror and some clearer expectations ahead on the rates front. They were strongly bid early in Thursday’s session, with Gold trading $4419.5 and slowly drifting most of the session to $4380. Early Asia traded in a $30 range, with bids coming back around 11 PM last night. Early Europe trading finds Gold trading above Thursday’s high at $4437.
Ten-year Treasury futures also stayed stronger post-FOMC. They climbed steadily all Thursday and traded up to the 106′10 overhead resistance area, which had proven to be resistance all week. Note that yields fell post the Fed Funds rate hike. Keeping watch here to see if we have a repeat of 2004 and 2015. It’s only been a day and a half, so too early to make anything of it.
Note that Crude Oil futures roll monthly and November is now the front month. Crude oil traded in a fairly narrow range most of Thursday. Overnight Friday has remained calm, with prices about $1.75 lower to $95.40 per barrel.
All in all, most markets seem to be trading with a tailwind post-FOMC, and that has carried through to European trading Friday morning. Aside from Industrial Production and Capacity Utilization numbers and a couple of Fed Governors speaking, there isn’t much of interest on the Economic Calendar Friday. Given that, markets will likely latch back onto the WTI Wall of worry. Let’s pray for humble leadership and peace this weekend.
All in all, most markets seem to be trading with a tailwind post-FOMC, and that has carried through to European trading Friday morning.
Context I’m watching
ES: 7720 support, 7765 resistance. At session highs at 7737 after bids returned around 11 PM. Below, 7700 has built a good volume shelf, with the month’s point of control just under it at 7680.
Gold: above Thursday’s high. Bid early Thursday to $4419.5, drifted to $4380, held a $30 range in Asia, and trades above that high at $4437 in early Europe. Silver breathed the same sigh of relief.
Tens: back at 106′10 resistance. Yields fell after the hike — watching for a repeat of 2004 and 2015, but a day and a half is too early to make anything of it.
Crude: November is now the front month. A narrow range Thursday, and a calm night about $1.75 lower to $95.40 a barrel.
A light calendar. Industrial Production, Capacity Utilization, and a couple of Fed Governors. With little else on the docket, markets will likely latch back onto the WTI Wall of worry.
Reference prices are front-month futures, delayed, for general information only — not investment advice; confirm before acting.
Morning Note
Right Back Where We Started
Thursday, September 17, 2026 · 5:00 AM ET
Reference · front-month futures · last price, delayed
S&P 500 · ESZ26
7,683.75
+60.75
Nasdaq 100 · NQZ26
29,556.50
+299.75
Gold · GCZ26
$4,352.0
−35.50
Silver · SIZ26
$64.345
−0.574
2-Yr Note · ZTZ26
101′30⅝
+0′01⅜
10-Yr Note · ZNZ26
105′30½
+0′05
WTI · CLV26
$101.30
−1.13
Bitcoin (Micro) · MBTU26
$76,600
+515
Warsh and Co. raised the benchmark Fed Funds rate by 25 basis points as expected. The market remained largely in suspended animation waiting for Warsh to speak 30 minutes later. S&P 500 futures, after digesting the news for a few minutes, sold off, but not as much as after the previous two announcements (6/17 −1.21% and 7/29 −1.52%). The S&P futures traded as low as 7575 before rebounding back up to 7625.25, and settling at 7622 (−0.44%, or −34 points).
From the US close, through Asia, and now into London, the bids have come back in. The sell-off bumped the point of control line down about 6 points to 7679.75, but we find ourselves right back where we started 24 hours earlier, 7674. Some resolution! Late September is historically a rough patch for equities, but with the Fed cloud lifted maybe we can get back to being constructive. First up would be a settle above 7720. From there, 7765 looks to provide the next level of overhead resistance.
Note on the chart below that although the S&P decisively broke through the bottom edge of the consolidation pattern it has been forming, it has almost as quickly found its way right back to it. All systems go?
E-mini S&P 500 (ESZ26), 60-minute with volume profile — the FOMC break below the consolidation and the snap back into it; point of control 7679.75, upper edge 7720.75. Chart: NinjaTrader.
Gold managed to take out $4400 ($4413.1), but turned south once the announcement came out and Warsh began to speak. Gold took out Tuesday’s low and traded as low as $4273.3 before rebounding and closing the day just above $4300, back where it started 12 hours earlier. And like any good replay, Gold finds itself right back in the $4355 to $4370 area it was in 24 hours ago. Again, some resolution!
Ten-year futures were at the high of the session at 106′11 when the rate news broke. They traded in pretty straight-line fashion to lows of the session at 105′21. They pretty much flatlined there as the rest of the world moved around them. Overnight they have caught a soft bid and have drifted up to as high as 106′02. Currently trading 106′00. I’ll save the sarcastic resolution remark, but will note that this is pretty much where we found ourselves at this time yesterday.
Sentiment has been so weak here that 10-year rates might just start making their way lower from here. The precedents were set in both 2004 and 2015. Long-end yields fell at the beginning of those hiking cycles. Yield curve, meet pancake.
Nothing gets you thinking about Crude oil futures quite like a Fed rate announcement. Like the other markets though, WTI was near highs of the session around $106.50 at 2:00 PM ET. They sold off in a little more orderly fashion than the others, but did make lows at $101.01 before bids came in to prop them up a bit to $102.77. They eventually settled $102.02. Overnight they’ve traded in about a $2 range, from $102.50 to $100.37. WTI is currently $101.41. Waiting for, don’t make me say it again, resolution.
Lastly, for BTC fans, I have not forgotten. It is on the radar, but it has been quietly lurking and waiting to make another dramatic entrance. After ticking $80,000 a week ago, it has traded in a $5000 range in a very undramatic fashion. Our little BTC seems to be all grown up now and trading more maturely. Still keeping an eye here to gauge risk appetites. Bids have come in slow and steady since the rate announcement. The dust is settling on the new rates landscape and it might be safe for BTC to come back out. Watching.
We find ourselves right back where we started 24 hours earlier, 7674. Some resolution!
Context I’m watching
ES: 7720 first, then 7765. The hike landed as expected and the sell-off was shallower than the last two announcements — 7575 low, back to 7625.25, settled 7622. A settle above 7720 is the first ask; 7765 is the next overhead resistance.
The break didn’t hold. Price decisively broke the bottom edge of the consolidation and found its way right back into it almost as quickly. The point of control came down about 6 points to 7679.75.
Gold: a full round trip. Took out $4400 at $4413.1, reversed on Warsh, took out Tuesday’s low at $4273.3, closed just above $4300 — and sits right back in the $4355 to $4370 area it held 24 hours ago.
Tens: 106′11 high, 105′21 low, back to 106′00. Sentiment is weak enough that 10-year rates might start working lower from here — long-end yields fell at the start of both the 2004 and 2015 hiking cycles. Yield curve, meet pancake.
WTI and BTC: still waiting. Crude ran to $106.50 into 2:00 PM, made lows at $101.01, settled $102.02, and trades $101.41 now. Bitcoin has gone quiet in a $5000 range since ticking $80,000 a week ago, with bids slow and steady since the announcement — a read on risk appetite.
Reference prices are front-month futures, delayed, for general information only — not investment advice; confirm before acting.
Morning Note
Put Up or Shut Up
Wednesday, September 16, 2026 · 4:45 AM ET
Reference · front-month futures · last price, delayed
S&P 500 · ESZ26
7,670.25
+14.25
Nasdaq 100 · NQZ26
29,347.75
+101.00
Gold · GCZ26
$4,368.9
+36.10
Silver · SIZ26
$64.955
+1.099
2-Yr Note · ZTZ26
102′01¼
+0′00¼
10-Yr Note · ZNZ26
105′29
−0′01
WTI · CLV26
$104.50
−1.33
Bitcoin (Micro) · MBTU26
$75,535
−630
Leading into today’s much anticipated FOMC rate decision, S&P futures are trading 15 points higher at 7672. Range over the last month has been 7825 to 7585.50 basis the December contract. The volume profile, as seen in the chart for ESZ26, shows a tightening range leading up to today’s main event, with the point of control just overhead at 7685.75. This is a classic triangle consolidation and it is looking for some resolution. Hopefully today’s announcement, and more importantly the press conference, brings it.
E-mini S&P 500 (ESZ26), 60-minute with volume profile — the triangle tightening into FOMC, point of control at 7685.75 just overhead. Chart: NinjaTrader.
Warsh is a real wildcard here. Handpicked by Trump, he has to walk a fine line between what the market is telling him (rates higher for longer) and what his boss wants (lowa foreva, damn the consequences, YOLO!).
Although gold has taken some body blows the last week or so, it is grabbing for the ropes at 4300 and has managed to pull itself up through the Asian session and into early Europe to 4370. It looks like it has settled on a lower-degree volume shelf here to wait out today’s session. Depending on what happens in the crazy world of WTI and bonds. Up next.
Ten-year note futures hit a low of 105′21 yesterday and have bounced a bit to 105′28. Markets are on edge with a 5% yield, but let’s hope they don’t grow comfortable with it. No market is more attuned to the Fed’s every utterance than the Treasury market. This is especially true on the short end, where the two-year note futures have been treading water right around the 102 handle (~4.65%). How flat are we going to go on 2s-10s?
WTI, what can we say. No war resolution. No WTI resolution. Crude got as high as 106.75 and as low as 101.2 in the last 24 hours. It’s resting comfortably at 104.3 with its point of control climbing by the day. That point of control is now up to 102.81. Every tick up there creates an area of price acceptance and support and resistance. Right now 102.81 will act as support unless some stupid tweet can break it free. These tweets have almost zero half-life left. We are at the point of put up or shut up. This goes for WTI and bonds. Let’s see what today brings! Pray for humility and peace.
We are at the point of put up or shut up. This goes for WTI and bonds.
Context I’m watching
ES: a triangle into the announcement. Trading 15 points higher at 7672, with the month’s range 7825 to 7585.50 basis December. The point of control sits just overhead at 7685.75 — a classic consolidation looking for resolution.
Warsh is the wildcard. The line he has to walk runs between what the market is telling him — rates higher for longer — and what his boss wants. The press conference matters more than the decision.
Gold: up off the ropes to 4370. Body blows for a week, a grab at 4300, then a pull up through Asia and into early Europe onto a lower-degree volume shelf to wait out the session.
Treasuries: 105′21 low, bounced to 105′28. On edge at a 5% yield, with the two-year treading water around the 102 handle (~4.65%). The open question is how flat 2s-10s go.
WTI: point of control climbing to 102.81. A 101.2 to 106.75 range in 24 hours, resting at 104.3. That level acts as support absent another headline — and the tweets have almost zero half-life left.
Reference prices are front-month futures, delayed, for general information only — not investment advice; confirm before acting.